PLEASE HELP
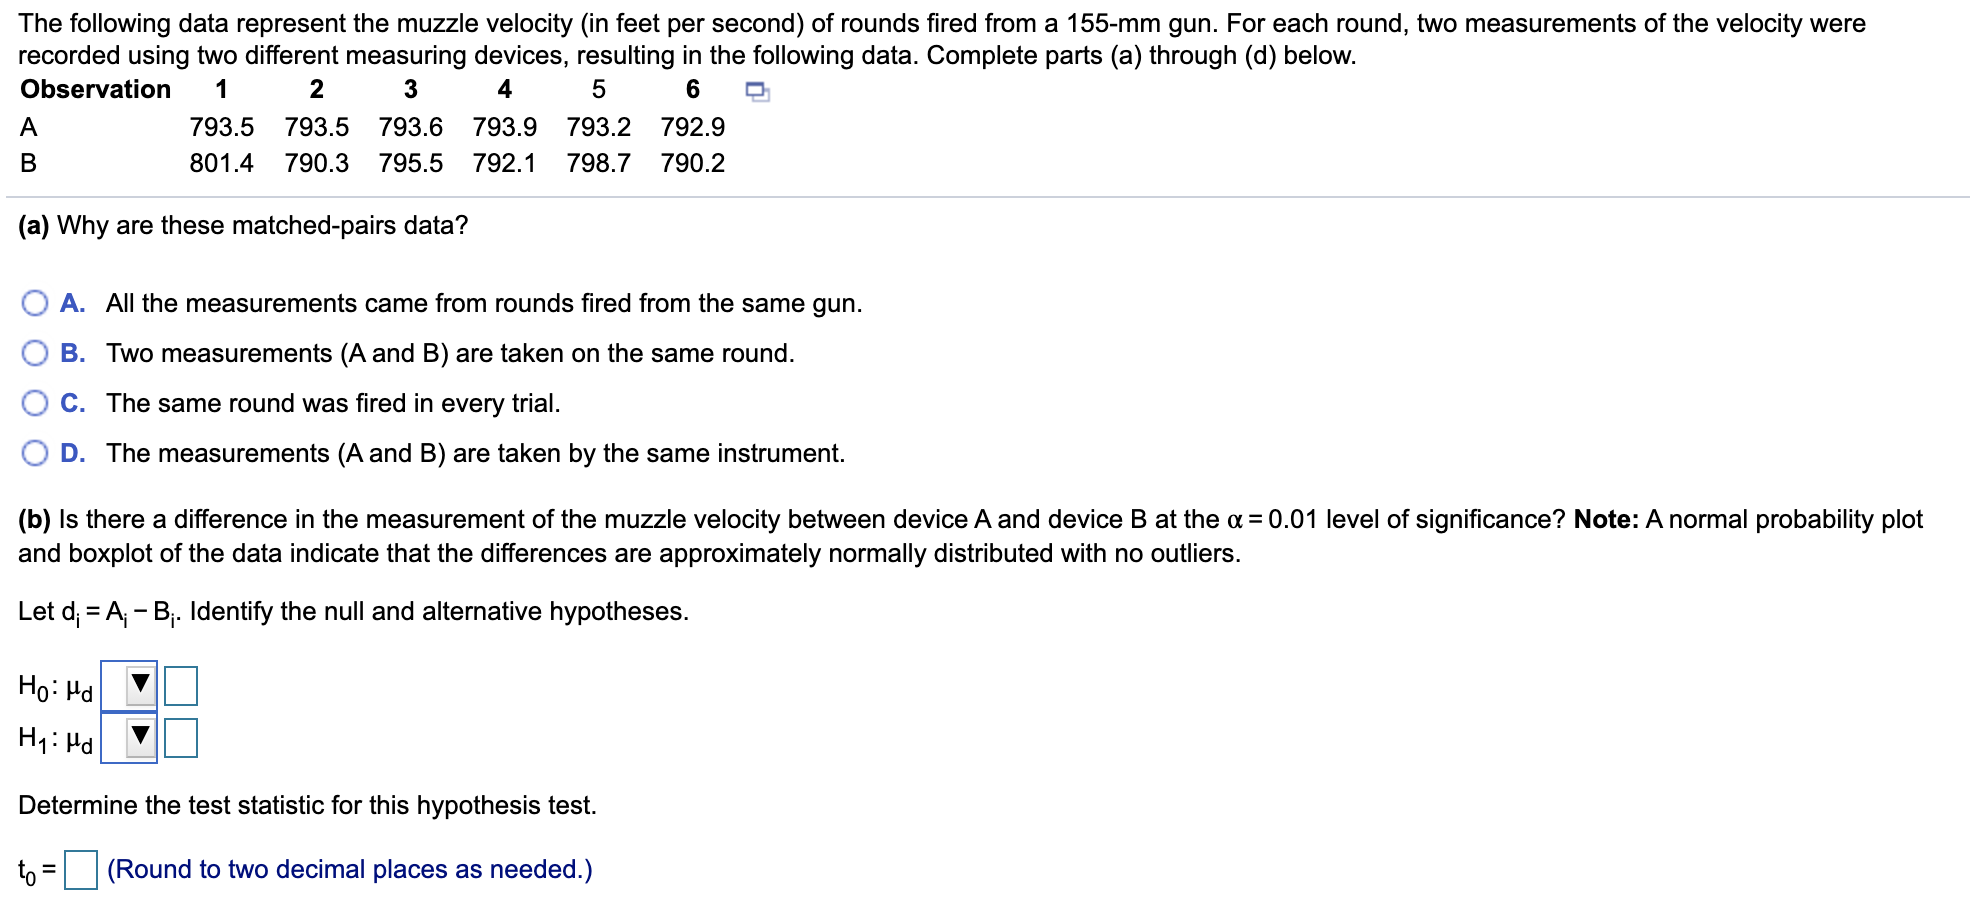
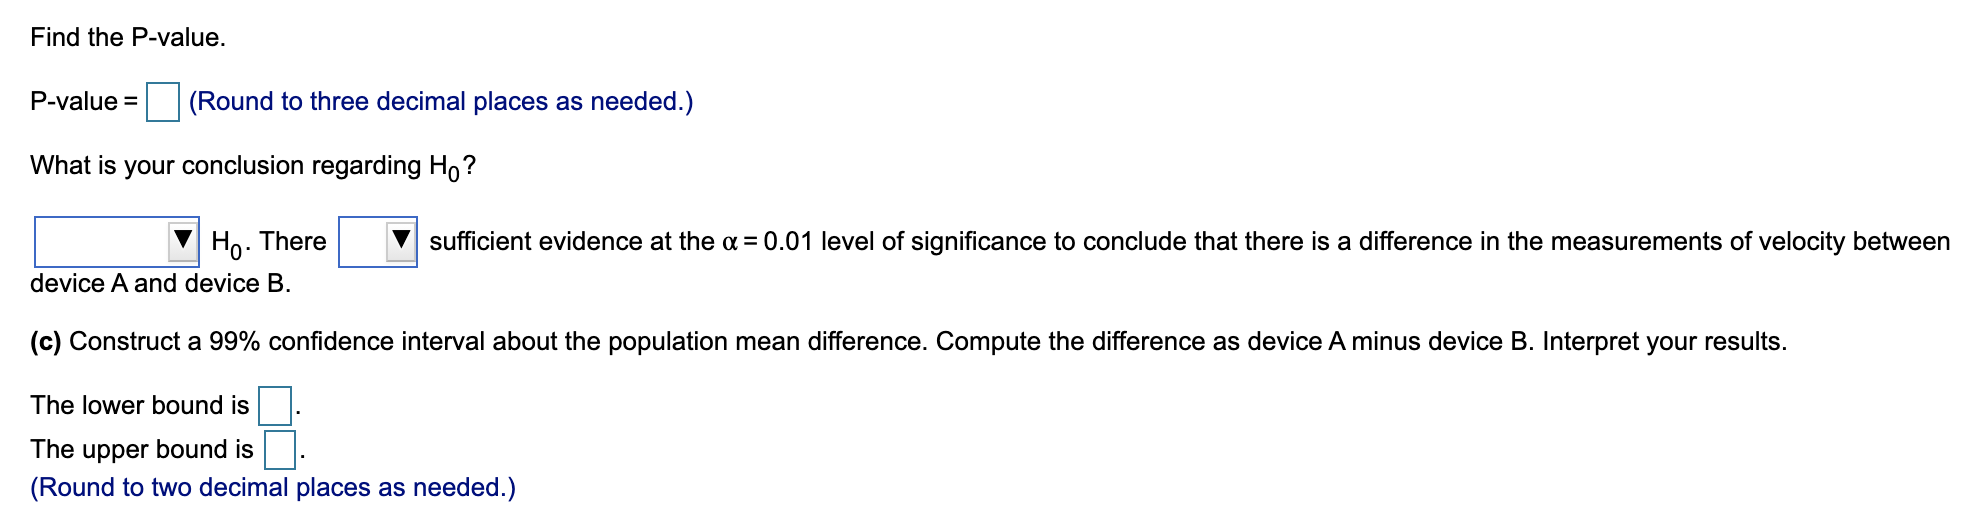
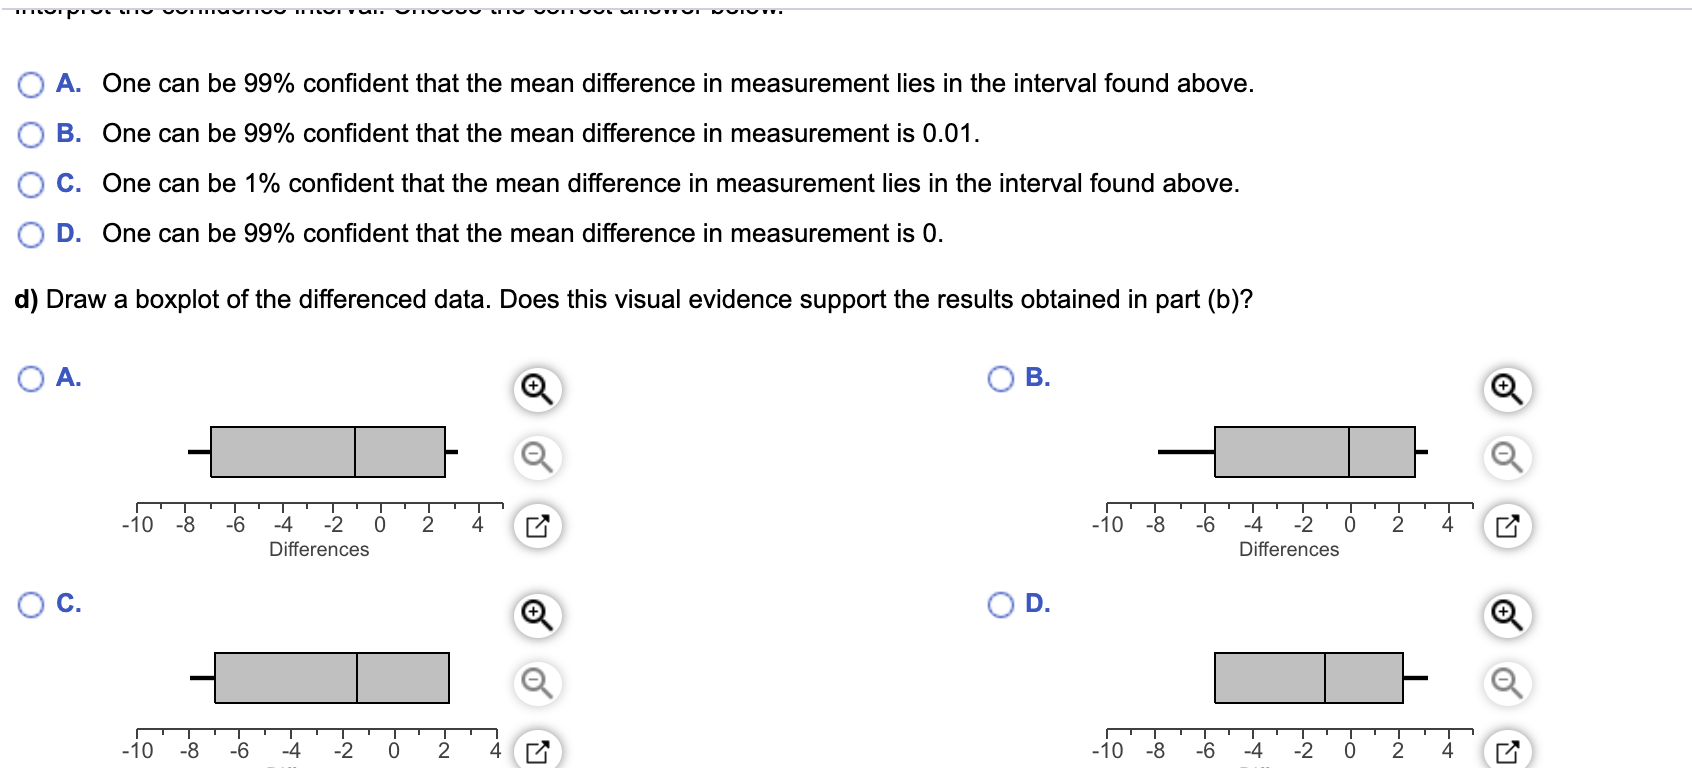
The following data represent the muule velocity (in feet per second) of rounds red from a 155mm gun. For each round, two measurements of the velocity were recorded using two different measuring devices, resulting in the following data. Complete parts (a) through (d) below. Observation 1 2 3 4 5 6 D A 793.5 793.5 793.6 793.9 793.2 792.9 B 801.4 790.3 795.5 792.1 798.7 790.2 (a) Why are these matched-pairs data? 0 A. All the measurements came from rounds red from the same gun. O B. Two measurements (A and B) are taken on the same round. 0 C. The same round was red in every trial. 0 D. The measurements (A and B) are taken by the same instrument. (b) Is there a difference in the measurement of the muzzle velocity between deviceA and device B at the 0: = 0.01 level of signicance? Note: A normal probability plot and boxplot of the data indicate that the differences are approximately normally distributed with no outliers. Let di = Ai Bi- Identify the null and alternative hypotheses. V V Determine the test statistic for this hypothesis test. t0 = Cl (Round to two decimal places as needed.) Find the P-value. P-value = (Round to three decimal places as needed.) What is your conclusion regarding Ho ? Ho. There sufficient evidence at the a = 0.01 level of significance to conclude that there is a difference in the measurements of velocity between device A and device B. (c) Construct a 99% confidence interval about the population mean difference. Compute the difference as device A minus device B. Interpret your results. The lower bound is The upper bound is (Round to two decimal places as needed.)O A. One can be 99% condent that the mean difference in measurement lies in the interval found above. 0 B. One can be 99% condent that the mean difference in measurement is 0.01. O C. One can be 1% condent that the mean difference in measurement lies in the interval found above. 0 D. One can be 99% condent that the mean difference in measurement is 0. d) Draw a boxplot of the differenced data. Does this visual evidence support the results obtained in part (b)? OA. OB. -10-8 -6-4-20 2 4 Differences -10-8 -6-4 -2 0 2 Differences -10 -8 67-74} -2 0 2 4 -10 -8 -6 4 -2 0 2 Does this visual evidence support the results obtained in part (b)? O A. Yes, because 0 is contained in the boxplot. O B. No, because the boxplot is too large. O C. Yes, because the boxplot shows no outliers. O D. No, because 0 is not contained in the boxplot