Please help to solve this problem. Please Use JAVA to solve this problem. the Iris file can be download from website
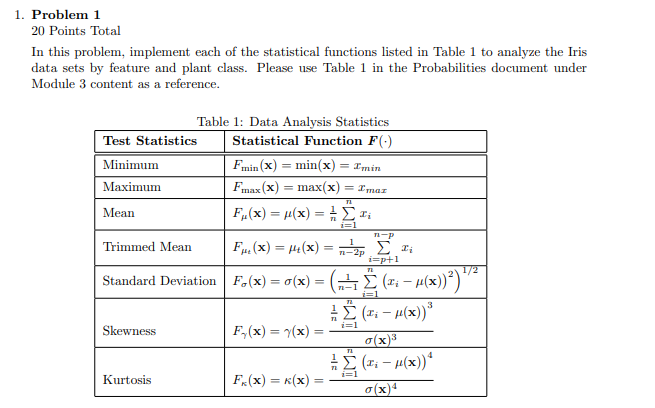
1. Problem 1 20 Points Total In this problem, implement each of the statistical functions listed in Table 1 to analyze the Iris data sets by feature and plant class. Please use Table 1 in the Probabilities document under Module 3 content as a reference. Table 1: Data Analysis Statistics Test Statistics Statistical Function F(-) Minimum Fmin(x) = min(x) = I'min Maximum Fmax(x) = max(x) = Imax Mean F.(x) = x(x) = ri TL TIP i=p+1 72 Trimmed Mean F..(x) = +(x) = n2p. Eli Standard Deviation Fo(x) = o(x) = (2+3 (22 u(x)?) "* (r: (x)) Skewness F.(x) = 7(x) g(x) (: - p(x)) F(x) = (x) g(x)" i=1 i=1 Kurtosis For clarification, the analysis should be done by feature followed by class of flower type. It should provide insight into the Iris data set. The analysis results should be put into tables for easy understanding The Iris data set is represented by the (150 x 4] matrix X, (1 x 4] vector X is the mean of the four features for all observations, x is the (150 x 1] vector representing the sepal length, xz is the (150 x 1] vector representing the sepal width, x3 is the [150 1] vector representing the petal length, and x is the [150 x 1] vector representing the petal width. Taking the notation a step further, let X1,e represents the vector for sepal length by class c = [1, 2, 3] (Setosa, Versicolor, Virginica), specifically, X1,1 be the (50 x 1] vector representing the sepal length for class 1 (Se- tosa), X1,2 be the (50 x 1] vector representing the sepal length for class 2 (Versicolor), and X1,3 be the [50 x 1] vector representing the sepal length for class 3 (Virginica). Note: The trimmed mean is a variation of the mean which is calculated by removing val- ues from the beginning and end of a sorted set of data. The average is then taken using the remaining values. This allows any potential outliers to be removed when calculating the statistics of the data. Assuming the data in x, = 21,5, 12,5 ., In,g) is sorted, the resulting Xs.p = [2 1+p, 12+p,In-p,s]. The trimmed mean allows the removal of extreme values in- fluencing the mean of the data. 1. Problem 1 20 Points Total In this problem, implement each of the statistical functions listed in Table 1 to analyze the Iris data sets by feature and plant class. Please use Table 1 in the Probabilities document under Module 3 content as a reference. Table 1: Data Analysis Statistics Test Statistics Statistical Function F(-) Minimum Fmin(x) = min(x) = I'min Maximum Fmax(x) = max(x) = Imax Mean F.(x) = x(x) = ri TL TIP i=p+1 72 Trimmed Mean F..(x) = +(x) = n2p. Eli Standard Deviation Fo(x) = o(x) = (2+3 (22 u(x)?) "* (r: (x)) Skewness F.(x) = 7(x) g(x) (: - p(x)) F(x) = (x) g(x)" i=1 i=1 Kurtosis For clarification, the analysis should be done by feature followed by class of flower type. It should provide insight into the Iris data set. The analysis results should be put into tables for easy understanding The Iris data set is represented by the (150 x 4] matrix X, (1 x 4] vector X is the mean of the four features for all observations, x is the (150 x 1] vector representing the sepal length, xz is the (150 x 1] vector representing the sepal width, x3 is the [150 1] vector representing the petal length, and x is the [150 x 1] vector representing the petal width. Taking the notation a step further, let X1,e represents the vector for sepal length by class c = [1, 2, 3] (Setosa, Versicolor, Virginica), specifically, X1,1 be the (50 x 1] vector representing the sepal length for class 1 (Se- tosa), X1,2 be the (50 x 1] vector representing the sepal length for class 2 (Versicolor), and X1,3 be the [50 x 1] vector representing the sepal length for class 3 (Virginica). Note: The trimmed mean is a variation of the mean which is calculated by removing val- ues from the beginning and end of a sorted set of data. The average is then taken using the remaining values. This allows any potential outliers to be removed when calculating the statistics of the data. Assuming the data in x, = 21,5, 12,5 ., In,g) is sorted, the resulting Xs.p = [2 1+p, 12+p,In-p,s]. The trimmed mean allows the removal of extreme values in- fluencing the mean of the data