

Question: please help urgent i'm crying Click the link on Piazza to set up your repository for HW 3, then clone it. The repository should contain
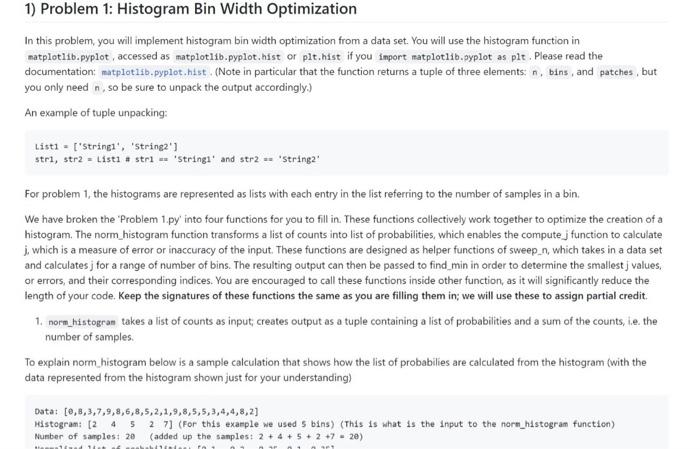
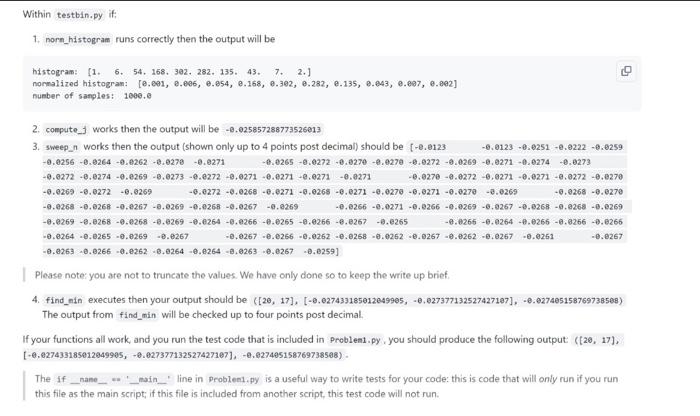
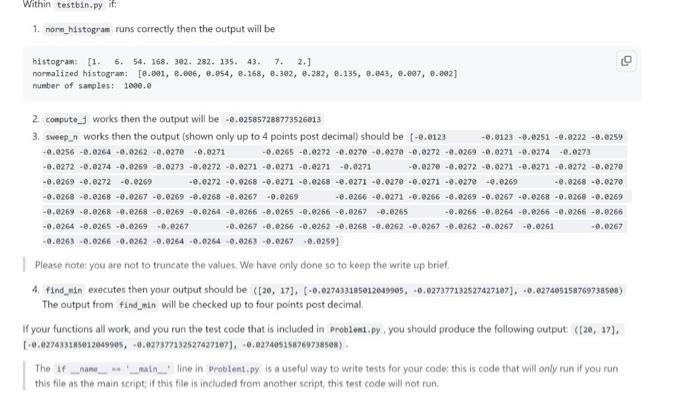
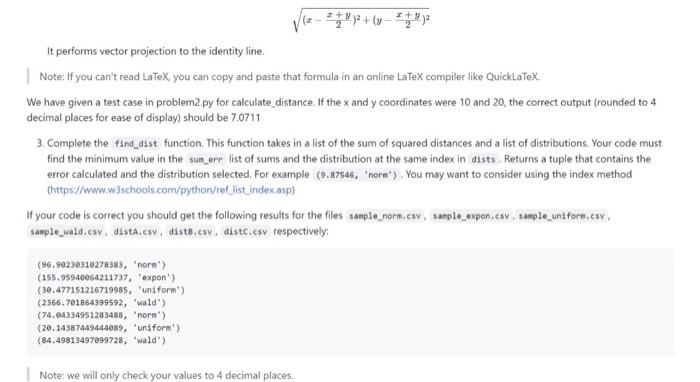
Click the link on Piazza to set up your repository for HW 3, then clone it. The repository should contain 12 files: 1. This README 2. Eight input data files: input. txt, which you will use in problem 1, and sample_expon.csv, sample_wald, csv, distA,csv, diste.esv, and distc,csv, which you will use in problem 2. 3. Problem1.py, a skeleton script for Problem 1 4. Problem2.py, a skeleton script for Problem 2 5. testbin.py, to help individually test the functions you will write in Problem1.py In this problem, you will implement histogram bin width optimization from a data set. You will use the histogram function in matplot11b.pyplot, accessed as matplot11b.pyplot.hist or plt.hist if you inport matplot116.pyplot as plt. Please read the documentation: matplot1ib.pyplot. hist. (Note in particular that the function returns a tuple of three elements: n, bins, and patches, but you only need n, so be sure to unpack the output accordingly.) An example of tuple unpacking: List1 = ['String1', 'String2'] str1, str2 = List1 # str1 = 'string1' and str2 = 'string2' For problem 1, the histograms are represented as lists with each entry in the list referring to the number of samples in a bin. We have broken the 'Problem 1.py' into four functions for you to fill in. These functions collectively work together to optimize the creation of a histogram. The norm_histogram function transforms a list of counts into list of probabilities, which enables the compute j function to calculate i. which is a measure of error or inaccuracy of the input. These functions are designed as helper functions of sweep_n, which takes in a data set and calculates j for a range of number of bins. The resulting output can then be passed to find min in order to determine the smallest j values, or errors, and their corresponding indices. You are encouraged to call these functions inside other function, as it will significantly reduce the length of your code. Keep the signatures of these functions the same as you are filling them in; we will use these to assign partial credit. 1. norm_histogran takes a list of counts as input; creates output as a tuple containing a list of probabilities and a sum of the counts, i.e. the number of samples. To explain norm histogram below is a sample calculation that shows how the list of probabilies are calculated from the histogram (with the data represented from the histogram shown just for your understanding) Data: [6,8,3,7,9,8,6,8,5,2,1,9,8,5,5,3,4,4,8,2] Histogram; [24527] (For this exarple we used 5 bins) (This is what is the input to the norm_histogram function) Nusber of samples: 20 (added up the samples: 2+4+5+2+7=20 ) 1. norn_histogram runs correctly then the output will be histogram: [1, 6. 54, 168, 392, 282, 135, 43, 7, 2,] nomalized histogran: [e.e91, e.ee6, e.854, e.168, e.392, e.282, e.135, e.e43, e.e97, e.e92] number of sasples: 1000.0 2. compute_] works then the output will be 0.025857288773526013 3. sweep_n works then the output (shown only up to 4 points post decimal) should be [e.e1230.0123.0251e.0222.0259 Please note: you are not to truncate the values. We have only done so to keep the write up brief. 4. find_nin executes then your output should be ([26,17],[0.027433185012649965,0,027377132527427187],0.027465158769738568) The output from find_min will be checked up to four points post decimal. If your functions all work, and you run the test code that is included in problen1.py. you should produce the following output: ([20, 17], [,627433185012049995,.027377132527427167],0.027405158769738508]= The if _name _ *. '- main - "line in problen1.py is a useful way to write tests for your code: this is code that will only run if you run this file as the main script; if this file is included from another script, this test code will not run. 1 runs correctly then the output will be histogran: [1. 6. 54,168,382,282,135,43,7,2, normalized histograni [0.91,8.e96,.054,8.168,8.392,.282,6.135,0.843,0.697,0.692] nueber of sanples: 1000.0 2. compute j works then the output will be 8.825857288773526013 3. sweep_n works then the output (shown only up to 4 points post decimal) should be [0.2123]6.91236.92519.022 - 9.6259 Please note: you are not to truncate the values. We have only done so to keep the write up brief. 4. find_min executes then your output should be ([20,17],[0.027433165012049905,0,027377132527427107]. 0.027405158769736508) The output from find_min will be checked up to four points post decimal. If your functions all work, and you run the test code that is included in Probleat,py , you should produce the following output ([2e, 17], [0.027433185012049905,4.027377132527427107],,0,027405158769738508). . The if _ nase_ w. math_ line in problesi, py is a useful way to write tests for your code: this is code that will only run if you run this file as the main script; if this file is included from another script, this test code will not run. (x2x+y)2+(y2x+y)2 It performs vector projection to the identity line. Note: If you can't read LaTeX, you can copy and paste that formula in an online LaTeX compiler like QuickLaTeX. We have given a test case in problem2 py for calculate distance. If the x and y coordinates were 10 and 20, the correct output (rounded to 4 decimal places for ease of display) should be 7.0711 3. Complete the find_dist function. This function takes in a list of the sum of squared distances and a list of distributions. Your code must find the minimum value in the sum_err list of sums and the distribution at the same index in dists. Returns a tuple that contains the error calculated and the distribution selected. For example (9.87546, 'norm'). You may want to consider using the index method (https//www.w3schoolscom/pythor/ref list index.asp) If your code is correct you should get the following results for the files sample_norm,cov, sanp1e_expon, cav, sarple_unifore,csv, sample_wald.csv, dista,csv, distb,csv, distc,csv respectively: (96.9023e31e278383,norn)(155.95946e64211737,expon)(30.477151216719985,uniform)(2366.7e1864399592,wald)(74.94334951283488,norn)(20.14387449444889,uniform)(84.49813497e99728,wa1d) Note: we will only check your values to 4 decimal places
Step by Step Solution
There are 3 Steps involved in it

Get step-by-step solutions from verified subject matter experts