please help
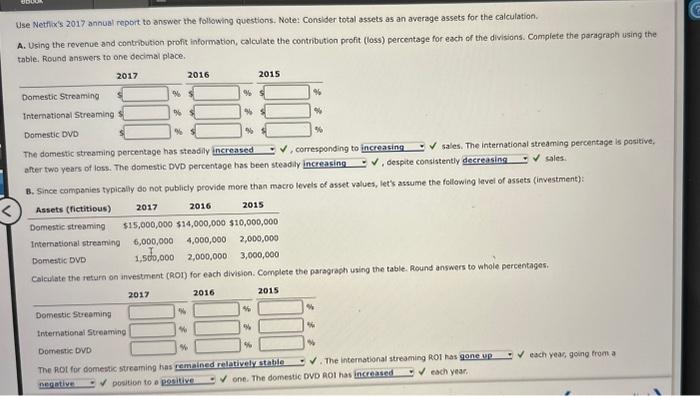
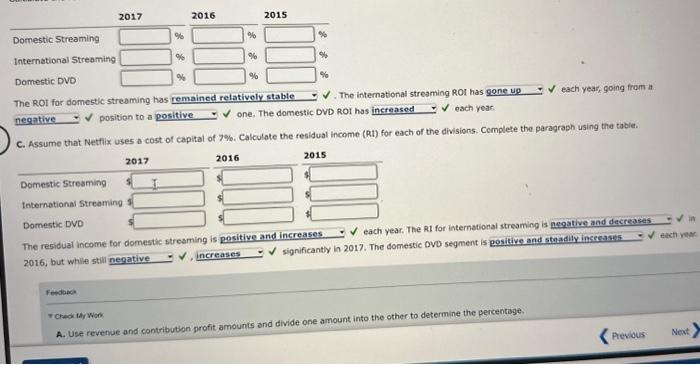
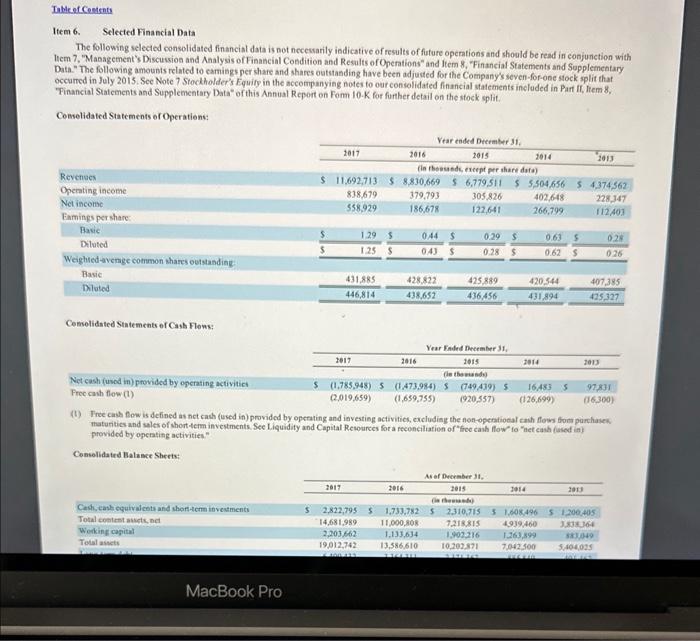
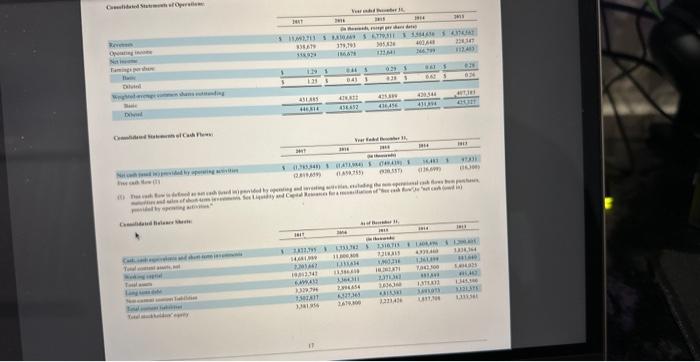
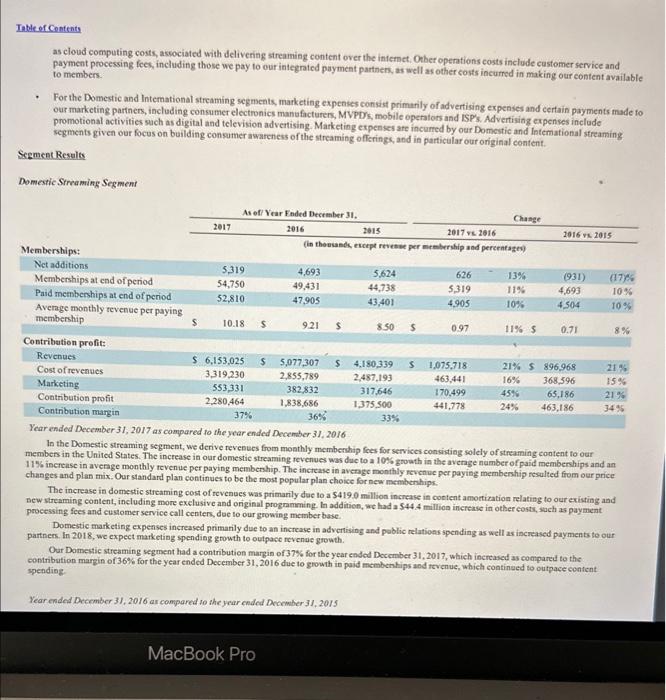
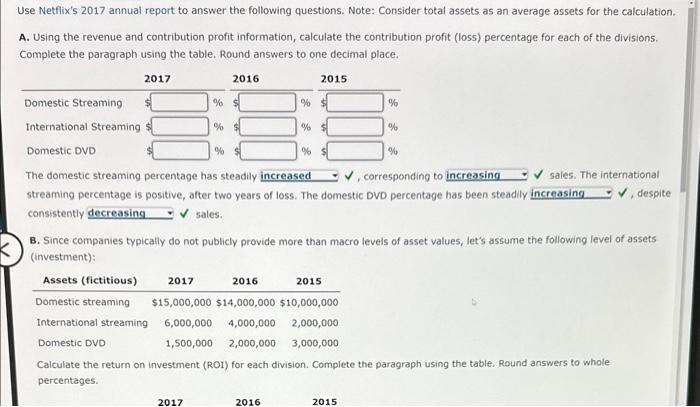
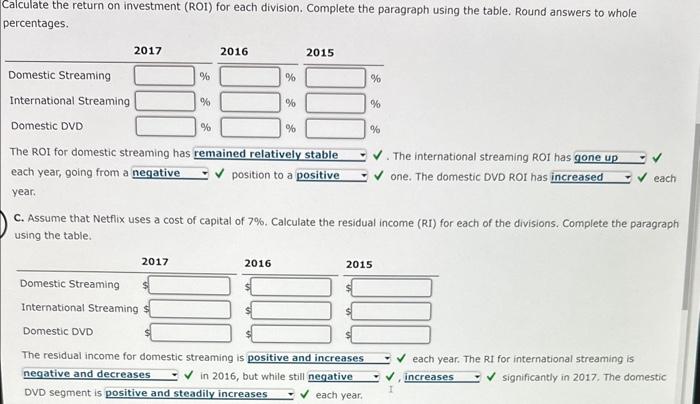
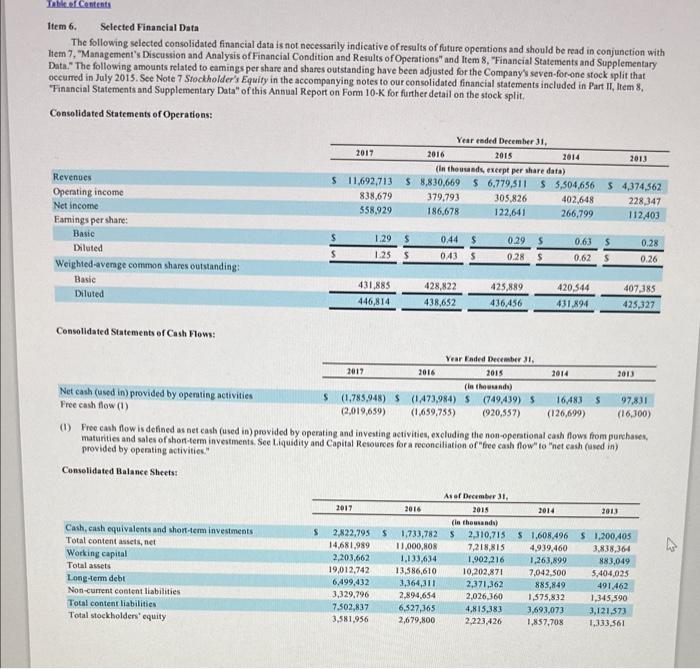
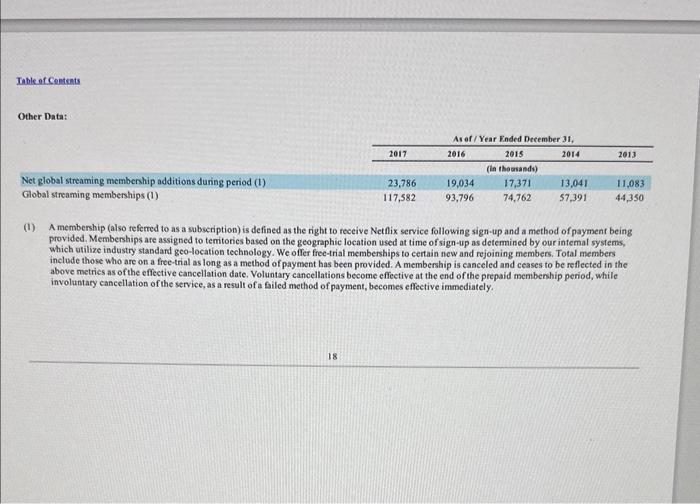
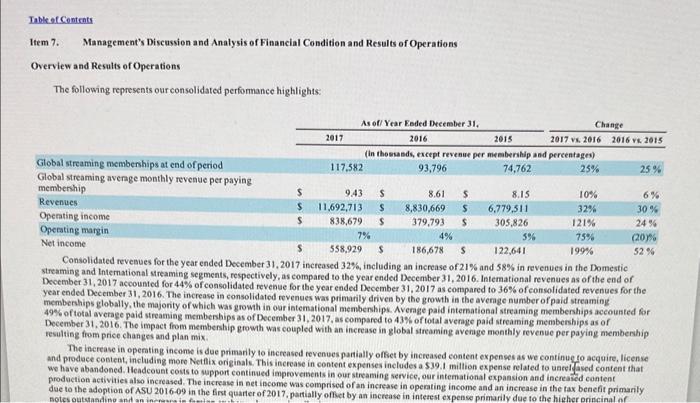
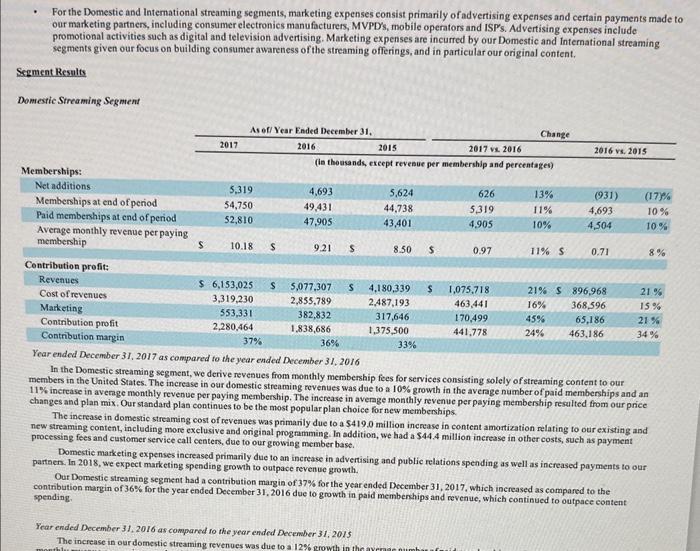
Use Netflix's 2017 annual report to answer the following questions. Note: Consider total assets as an average assets for the calculation. A. Using the revenue and contrbution profit information, calculate the contribution profit (loss) percentage for each of the divisions. Complete the paragraph using the table, Round answers to one docimal place. The domestic streaming percentage has stesdily after two years of loss. The domestic DND percentage has been steadily B. Since companies typically do not publicly provide more than mocro levels of asset values, let's assume the fellowisg lavel of assets (investment): Calculate the return on investiment (RO) for each division. Complete the paragraph using the table. Round answers to whole percentages. The Rot for domestic steaming has remained relativety statile o . The international streaening Rol has each year, geing tron a Dorition to a Y one. The domestic DVD hot has each year. The ROI for domestic streaming has remained retatively stable . The international streaming ROr has each year, going from at position to a one. The domestic DVD ROI has each year. C. Assume that Netflix uses a cost of capital of 7\%. Calculate the residual income (RD) for each of the divisions. Complete the paragraph using the table. significantly in 2017. The domestic DVD segment is) 2016, but while still feedtoce A. Use revenue and contribution profit amounts and divide one amount into the other to determine the percentage- * cresi th woo Item 6. Selected Financial Data The following selected consolidated financial data is not necewarily isdicative of results of future opentions and should be read in conjunction with liem 7, "Maoagement's Discussioa and Analysis ofFinancial Condition and Results of Opentions" and Jtem 8, "Financial Statements and Sopplementary Duta-" The following amounts related to eamings per share and shares outstanding have been adjusted for the Company's seven-for-one stock split that occurred in July 2015. See Note 7 Stockolder's Equity in the accompanying notes to our consolidated financial statements included in Part II, liem 8 , Financial Suatements and Supplementary Data" of this Annial Report on Fom 10.K for further detail on the stock split. Comselidated Statements of Operatiens: Cemolidated Stntementr of Cast Flows: (1) Free cass bow is defined as nct cach (Used in) provided by openting and ievesting activities, excluding the non-opentional eash flows flom poirchasen provided by openting activitien" Censolidatrd Balasce Sberts: as cloud computing costs, astociated with delivering streaming content over the infemet. Obber operations costs include customer service and payment processing fces, including those we pay to our integrated payment partnen, as well as other costs incumed in making our content available to members. - For the Domestic and Intemational streaming segments, marketing expenses consist primarily of advertising expenses and certain payments made fo our marketing partners, including consumer electronics manufacturens, MVPDS, mobile operators and ISPS. Advertising expenses include promotional activities sach as digital and television advertising. Marketing expenses are incumed by our Domestic and Intemational streaming segments given our focus on building conwamer awareness of the streaming offerings, and in particular our original content. Scement Results Domestic Srreaming Segment xear enaed Lecember 31, 2017 as compared to the year ended December 31, 2016 In the Domestic streaming segment, we derive revenees from monthly membenhip faes for services consisting solely of streaming content fo oar members in the United States. The increase in our domestic streaming revenues was due to a 10 ot growth in the average namber of paid membenhips and an 11% increase in average monthly revenue per paying membership. The increase in avenge monthly revenue per paying membership resulted from our price changes and plan mix. Our standard plan continues to be the most popular plan choice for new memberhips: The increase in domestic streaming cost of revenues was primanly due to a $419.0 million increase in coetent amortiration relating to our existing and Bew streaming content, including more exclusive and orginal prognamming. In additien, we had a 544.4 million incrense in other costs, 3 toch as payment. processing fees and customer service call centers, doe so our growing member base. Domestic marketing expenses increased primarily due to an increase in advertising and poblic relations spending as well as increased payments to our partners. In 2018, we expect marketing spendiag growth to oulpace rcvenue growth. Our Domestic streaming segment had a contribution margin of 37% for the year ended December 31, 2017, which increased as compared to the eontribation margin of 36% for the year ended December 31,2016 due to growth in paid membenhips and revenue, which contineed to outpace content spendieg. Item 7. Management's Discussion and Analysis of Financial Condition and Results of Operations Overview and Results of Operations The following represents our consolidated perfomance highlights: Consonaatea revenues for the year ended December 31,2017 increased 32%, ineluding an increase of 21% and 58% in revenues in the Domestic straming and lntemational streaming segments, respectively, as compared to the year ended Deeember 31,2016 . Intemational revenues as of the end of December 31,2017 accounted for 44% of consolidated revenae for the year ended December 31,2017 as compared to 36% of consolidated revenues for the. year ended December 31, 2016. The inctease in consolidated revenues was primanily driven by the growth in the average number of paid sitraming membenhips globally, the majority of which was growth in our intemational membenhips. Average paid intemational streaming memberships accounted for 49% of total avenge paid streaming memberships as of December 31,2017 , as compared to 43% of total average paid atreaming membenhips as of December 31,2016 . The impact from memberhip growh was coupled with an increase in global streaming average monthly revenue per paying membership resalting from priee changes and plan mix. The increase in openting income is due primarily to increased revenues partially offet by increased content expenses as we continue fo acquire, license and produce content, including more Netfix originals. This increase in content expenses includes a $39.1 million expense related to uneteased content that we have abandoned. Headcount costs to support continued improvements in our sireaming service, our intemational expansion and increased content production activities also increased. The increase in set income was comprised of an increase in operating income and an inerease in the tax benefit primarily due to the adoption of ASU 2016-09 in the firt quarter of 2017, partially offset by an increase in interest expense primarily due to the higher principal of notes sutstanding and an increase in foreign exchange losses primanily due to the remeasurement of our euro denominated senior notes. We offer three types of streaming membership plans. Our "basic" plan includes aceess to standard definition quality streaming on a single screen at a time. Our "standard" plan is our most popolar streaming plan and includes access to high definition quality streaming on two screns concumently, Our "premium" plan includes access to high definition and ultra-high definition quality content on four sereens concurrently, As of Deeember 31,2017 , pricing. on ourplans nanged in the US. from $7.99 to $13.99 permonth and intemationally from the U.S. dollar equivalent of approximately $4 to $20 per month. We expect that from time to time the prices of our membership plans in each country may increase. The following represents the key elements to our segment results of openations: - We define contribution profit (loss) as revenues less cont of revenves and marketing expenses incurred by the segment. We believe this is an important measure of our operating segment performanee as it represents each seemeatknerfurmanra hafime atahal no. We believe this is an Use Netflix's 2017 annual report to answer the following questions. Note: Consider total assets as an average assets for the calculation. A. Using the revenue and contribution profit information, calculate the contribution profit (loss) percentage for each of the divisions. Complete the paragraph using the table. Round answers to one decimal place. The domestic streaming percentage has steadily , corresponding to sales. The international streaming percentage is positive, after two years of loss. The domestic DVD percentage has been steadily , despite consistently sales. B. Since companies typically do not publicly provide more than macro levels of asset values, let's assume the following level of assets (investment): Calculate the return on investment (ROI) for each division. Complete the paragraph using the table. Round answers to whole percentages. Calculate the return on investment (ROI) for each division. Complete the paragraph using the table. Round answers to whole bercentages. The ROI for domestic streaming has remained relatively stable . The international streaming ROI has each year, going from a positiontoa one. The domestic DVD ROI has year. C. Assume that Netflix uses a cost of capital of 7%. Calculate the residual income (RI) for each of the divisions. Complete the paragraph using the table. The residual income for domestic streaming is positive and increases each year. The RI for international streaming is in 2016, but while still! , significantly in 2017. The domestic DVD segment is positive and steadily increases each year. Item 5. Market for Registrant's Common Equity, Related Stoekholder Matters and Issuer Purehases of Equity Seearifies Market information Our common stock is taded on the NASDAQ Global Select Market under the symbol "NFLX". The following table sets forth the intraday high asd low sales prices per share of out common stock for the periods indicated, as reported by the NASDMQ Global Select Market. Fint quarter Srcond quarter Thind quarter Fourth quarter Holders As of January 25, 2018, there were approximately 327 stockbolders of recond of our common stock, although there is a significantly lager number of beneficial ownets of our common stock. Dividends We have not declared or paid any cash dividends, and we have no present intention of paying any cash dividends in the foresecable firare. Item 6. Selected Financial Data The following selected consolidated financial data is not necessarily indicative of results of future opentions aad should be read in conjunction with liem 7, "Management's Discussion and Analysis of Financial Condition and Results of Opentions" and ltem 8, "Financial Statements and Supplementary Data." The following amounts related to eamings per share and shares outstanding have been adjusted for the Company's seven-for-one stock split that occumed in July 2015. See Note 7 Stoctholder's Equity in the accompanying notes to our consolidated financial statements included in Part II, Iitem 8. "inancial Statements and Supplementary Data" of this Ansual Report on Form 10K for further detail on the stock split. Consolidated Statements of Operations: Consolidated Statements of Cash Flows: (1) Froe cash flow is defined as net cash (used in) provided by operating and investing activities, exeluding the non-opentional cash flows fom punchasex, maturities and sales of short-term investments See Liquidity and Capital Resoures for a reconciliation of "free cash flow" to "net cash (ased in) provided by openting activities." Conselidated Balanee Sheets: 1) A membership (also referred to as a subseription) is defined as the right to receive Netflix service following sign-up and a method of payment being provided. Memberships are assigned to temitorics based on the geographic location used at time of sign-up as detemined by our intemal systems, which utilize industry standard geo-location technology. We ofler free-trial memberships to certain new and rejoining members. Total member inclode those who are on a free-trial as long as a method of payment has been provided. A membership is canceled and ceases to be reflected in the above metries as of the effective cancellation date. Voluntary cancellations become effective at the end of the prepaid membenhip period, while involuntary cancellation of the service, as a restlt of a failed method of payment, becomes effective immediately. Item 7. Management's Discussion and Analysis of Financial Condition and Results of Operations Overview and Results of Operations The following represents our consolidated performance highlights: streaming anduacu revesues ror the year ended December 31,2017 increased 32% including an increase of 21% and 58% in revenues in the Domestic December 31 , Intemational streaming segments, respectively, as compared to the year ended December 31,2016 . Intemational revenues as of the end of year ended Dec 3017 accounted for 44% of consolidated revenue for the year ended December 31,2017 as compared to 36% of eonsolidated revenues for the. membershipecember 31, 2016. The increase in consolidated revenues was primarily driven by the growth in the avenage number of paid streaming 49% of total globally, the majority of which was growh in our intemational memberships. Average paid intemational streaming avemberships accounted for December average paid streaming memberhips as of December 31, 2017, as compared to 43% of total average paid streaming memberships as of resultise trom price changes and plan mix The inerease in operating income is due primarily to increased revenues panially offiet by increased content expenses as we continug to acquire, license and prodace content, including more Netflix originals. This increase in content expenses includes a 539.1 miltion expense related to uaetlgased content that we have abandoned. Headcount costs to support contimued improvements in our streaming service, our intemational expansion and increased content prodaction activitiei also increased. The increase in net iscome was comprised of an increase in operating income aad an increase in the tax benefit primarity due to the adoption of ASU 2016.09 in the Erst guarter of 2017 , partially ofluet by an iscrease in interest expense primarily due to the higher oriecinal of - For the Domestic and Intemational streaming segments, marketing expenses consist primarily of advertising expenses and certain payments made to our marketing partners, including consumer cleetronics manufacturers, MVPD's, mobile operators and ISP's. Advertising expenses include promotional activities such as digital and television advertising. Marketing expenses are incurred by our Domestic and International streaming segments given our focus on building consumer awareness of the streaming offerings, and in particular our original content. Segment Results Domestic Streaming Segment As ef Year Ended December 31. members in the United Straming segment, we derive revenues from monthly membership fees for services consisting solely of streaming content to our 11% increase in avemge mom. The increase in our domestic streaming revenues was due to a 10% growth in the average number of paid memberships and an changes and plan mix. Our stand revenue per paying membership. The increase in average monthly nevenue perpaying memberhip resulted from our price The increase in domeste sthe continues to be the most popular plan choice for new memberships. new streaming content, inelic streaming cost of revenues was primanily due to a 5419.0 million increase in conteat amortization relating to our existing and processing fees and customer ser. more exclusive and oniginal prognmming. In addition, we had a $44,4 million increase in other costs, sueh as payment Nice call centers, due to our growing member base. partaen. In 2018, werketing expenses increased primanily due to an increase in advertising and public relations spending as well as increased payments to our Our Domestic strect marketing spending growth to outpace revenue growth. Our Domestic streamiag segment had a contribution margin of 37% for the year ended December 31,2017 , which inereased as compared to the spending. Year ended December 31,2016 as compared to the year ended December 31,2015 Use Netflix's 2017 annual report to answer the following questions. Note: Consider total assets as an average assets for the calculation. A. Using the revenue and contrbution profit information, calculate the contribution profit (loss) percentage for each of the divisions. Complete the paragraph using the table, Round answers to one docimal place. The domestic streaming percentage has stesdily after two years of loss. The domestic DND percentage has been steadily B. Since companies typically do not publicly provide more than mocro levels of asset values, let's assume the fellowisg lavel of assets (investment): Calculate the return on investiment (RO) for each division. Complete the paragraph using the table. Round answers to whole percentages. The Rot for domestic steaming has remained relativety statile o . The international streaening Rol has each year, geing tron a Dorition to a Y one. The domestic DVD hot has each year. The ROI for domestic streaming has remained retatively stable . The international streaming ROr has each year, going from at position to a one. The domestic DVD ROI has each year. C. Assume that Netflix uses a cost of capital of 7\%. Calculate the residual income (RD) for each of the divisions. Complete the paragraph using the table. significantly in 2017. The domestic DVD segment is) 2016, but while still feedtoce A. Use revenue and contribution profit amounts and divide one amount into the other to determine the percentage- * cresi th woo Item 6. Selected Financial Data The following selected consolidated financial data is not necewarily isdicative of results of future opentions and should be read in conjunction with liem 7, "Maoagement's Discussioa and Analysis ofFinancial Condition and Results of Opentions" and Jtem 8, "Financial Statements and Sopplementary Duta-" The following amounts related to eamings per share and shares outstanding have been adjusted for the Company's seven-for-one stock split that occurred in July 2015. See Note 7 Stockolder's Equity in the accompanying notes to our consolidated financial statements included in Part II, liem 8 , Financial Suatements and Supplementary Data" of this Annial Report on Fom 10.K for further detail on the stock split. Comselidated Statements of Operatiens: Cemolidated Stntementr of Cast Flows: (1) Free cass bow is defined as nct cach (Used in) provided by openting and ievesting activities, excluding the non-opentional eash flows flom poirchasen provided by openting activitien" Censolidatrd Balasce Sberts: as cloud computing costs, astociated with delivering streaming content over the infemet. Obber operations costs include customer service and payment processing fces, including those we pay to our integrated payment partnen, as well as other costs incumed in making our content available to members. - For the Domestic and Intemational streaming segments, marketing expenses consist primarily of advertising expenses and certain payments made fo our marketing partners, including consumer electronics manufacturens, MVPDS, mobile operators and ISPS. Advertising expenses include promotional activities sach as digital and television advertising. Marketing expenses are incumed by our Domestic and Intemational streaming segments given our focus on building conwamer awareness of the streaming offerings, and in particular our original content. Scement Results Domestic Srreaming Segment xear enaed Lecember 31, 2017 as compared to the year ended December 31, 2016 In the Domestic streaming segment, we derive revenees from monthly membenhip faes for services consisting solely of streaming content fo oar members in the United States. The increase in our domestic streaming revenues was due to a 10 ot growth in the average namber of paid membenhips and an 11% increase in average monthly revenue per paying membership. The increase in avenge monthly revenue per paying membership resulted from our price changes and plan mix. Our standard plan continues to be the most popular plan choice for new memberhips: The increase in domestic streaming cost of revenues was primanly due to a $419.0 million increase in coetent amortiration relating to our existing and Bew streaming content, including more exclusive and orginal prognamming. In additien, we had a 544.4 million incrense in other costs, 3 toch as payment. processing fees and customer service call centers, doe so our growing member base. Domestic marketing expenses increased primarily due to an increase in advertising and poblic relations spending as well as increased payments to our partners. In 2018, we expect marketing spendiag growth to oulpace rcvenue growth. Our Domestic streaming segment had a contribution margin of 37% for the year ended December 31, 2017, which increased as compared to the eontribation margin of 36% for the year ended December 31,2016 due to growth in paid membenhips and revenue, which contineed to outpace content spendieg. Item 7. Management's Discussion and Analysis of Financial Condition and Results of Operations Overview and Results of Operations The following represents our consolidated perfomance highlights: Consonaatea revenues for the year ended December 31,2017 increased 32%, ineluding an increase of 21% and 58% in revenues in the Domestic straming and lntemational streaming segments, respectively, as compared to the year ended Deeember 31,2016 . Intemational revenues as of the end of December 31,2017 accounted for 44% of consolidated revenae for the year ended December 31,2017 as compared to 36% of consolidated revenues for the. year ended December 31, 2016. The inctease in consolidated revenues was primanily driven by the growth in the average number of paid sitraming membenhips globally, the majority of which was growth in our intemational membenhips. Average paid intemational streaming memberships accounted for 49% of total avenge paid streaming memberships as of December 31,2017 , as compared to 43% of total average paid atreaming membenhips as of December 31,2016 . The impact from memberhip growh was coupled with an increase in global streaming average monthly revenue per paying membership resalting from priee changes and plan mix. The increase in openting income is due primarily to increased revenues partially offet by increased content expenses as we continue fo acquire, license and produce content, including more Netfix originals. This increase in content expenses includes a $39.1 million expense related to uneteased content that we have abandoned. Headcount costs to support continued improvements in our sireaming service, our intemational expansion and increased content production activities also increased. The increase in set income was comprised of an increase in operating income and an inerease in the tax benefit primarily due to the adoption of ASU 2016-09 in the firt quarter of 2017, partially offset by an increase in interest expense primarily due to the higher principal of notes sutstanding and an increase in foreign exchange losses primanily due to the remeasurement of our euro denominated senior notes. We offer three types of streaming membership plans. Our "basic" plan includes aceess to standard definition quality streaming on a single screen at a time. Our "standard" plan is our most popolar streaming plan and includes access to high definition quality streaming on two screns concumently, Our "premium" plan includes access to high definition and ultra-high definition quality content on four sereens concurrently, As of Deeember 31,2017 , pricing. on ourplans nanged in the US. from $7.99 to $13.99 permonth and intemationally from the U.S. dollar equivalent of approximately $4 to $20 per month. We expect that from time to time the prices of our membership plans in each country may increase. The following represents the key elements to our segment results of openations: - We define contribution profit (loss) as revenues less cont of revenves and marketing expenses incurred by the segment. We believe this is an important measure of our operating segment performanee as it represents each seemeatknerfurmanra hafime atahal no. We believe this is an Use Netflix's 2017 annual report to answer the following questions. Note: Consider total assets as an average assets for the calculation. A. Using the revenue and contribution profit information, calculate the contribution profit (loss) percentage for each of the divisions. Complete the paragraph using the table. Round answers to one decimal place. The domestic streaming percentage has steadily , corresponding to sales. The international streaming percentage is positive, after two years of loss. The domestic DVD percentage has been steadily , despite consistently sales. B. Since companies typically do not publicly provide more than macro levels of asset values, let's assume the following level of assets (investment): Calculate the return on investment (ROI) for each division. Complete the paragraph using the table. Round answers to whole percentages. Calculate the return on investment (ROI) for each division. Complete the paragraph using the table. Round answers to whole bercentages. The ROI for domestic streaming has remained relatively stable . The international streaming ROI has each year, going from a positiontoa one. The domestic DVD ROI has year. C. Assume that Netflix uses a cost of capital of 7%. Calculate the residual income (RI) for each of the divisions. Complete the paragraph using the table. The residual income for domestic streaming is positive and increases each year. The RI for international streaming is in 2016, but while still! , significantly in 2017. The domestic DVD segment is positive and steadily increases each year. Item 5. Market for Registrant's Common Equity, Related Stoekholder Matters and Issuer Purehases of Equity Seearifies Market information Our common stock is taded on the NASDAQ Global Select Market under the symbol "NFLX". The following table sets forth the intraday high asd low sales prices per share of out common stock for the periods indicated, as reported by the NASDMQ Global Select Market. Fint quarter Srcond quarter Thind quarter Fourth quarter Holders As of January 25, 2018, there were approximately 327 stockbolders of recond of our common stock, although there is a significantly lager number of beneficial ownets of our common stock. Dividends We have not declared or paid any cash dividends, and we have no present intention of paying any cash dividends in the foresecable firare. Item 6. Selected Financial Data The following selected consolidated financial data is not necessarily indicative of results of future opentions aad should be read in conjunction with liem 7, "Management's Discussion and Analysis of Financial Condition and Results of Opentions" and ltem 8, "Financial Statements and Supplementary Data." The following amounts related to eamings per share and shares outstanding have been adjusted for the Company's seven-for-one stock split that occumed in July 2015. See Note 7 Stoctholder's Equity in the accompanying notes to our consolidated financial statements included in Part II, Iitem 8. "inancial Statements and Supplementary Data" of this Ansual Report on Form 10K for further detail on the stock split. Consolidated Statements of Operations: Consolidated Statements of Cash Flows: (1) Froe cash flow is defined as net cash (used in) provided by operating and investing activities, exeluding the non-opentional cash flows fom punchasex, maturities and sales of short-term investments See Liquidity and Capital Resoures for a reconciliation of "free cash flow" to "net cash (ased in) provided by openting activities." Conselidated Balanee Sheets: 1) A membership (also referred to as a subseription) is defined as the right to receive Netflix service following sign-up and a method of payment being provided. Memberships are assigned to temitorics based on the geographic location used at time of sign-up as detemined by our intemal systems, which utilize industry standard geo-location technology. We ofler free-trial memberships to certain new and rejoining members. Total member inclode those who are on a free-trial as long as a method of payment has been provided. A membership is canceled and ceases to be reflected in the above metries as of the effective cancellation date. Voluntary cancellations become effective at the end of the prepaid membenhip period, while involuntary cancellation of the service, as a restlt of a failed method of payment, becomes effective immediately. Item 7. Management's Discussion and Analysis of Financial Condition and Results of Operations Overview and Results of Operations The following represents our consolidated performance highlights: streaming anduacu revesues ror the year ended December 31,2017 increased 32% including an increase of 21% and 58% in revenues in the Domestic December 31 , Intemational streaming segments, respectively, as compared to the year ended December 31,2016 . Intemational revenues as of the end of year ended Dec 3017 accounted for 44% of consolidated revenue for the year ended December 31,2017 as compared to 36% of eonsolidated revenues for the. membershipecember 31, 2016. The increase in consolidated revenues was primarily driven by the growth in the avenage number of paid streaming 49% of total globally, the majority of which was growh in our intemational memberships. Average paid intemational streaming avemberships accounted for December average paid streaming memberhips as of December 31, 2017, as compared to 43% of total average paid streaming memberships as of resultise trom price changes and plan mix The inerease in operating income is due primarily to increased revenues panially offiet by increased content expenses as we continug to acquire, license and prodace content, including more Netflix originals. This increase in content expenses includes a 539.1 miltion expense related to uaetlgased content that we have abandoned. Headcount costs to support contimued improvements in our streaming service, our intemational expansion and increased content prodaction activitiei also increased. The increase in net iscome was comprised of an increase in operating income aad an increase in the tax benefit primarity due to the adoption of ASU 2016.09 in the Erst guarter of 2017 , partially ofluet by an iscrease in interest expense primarily due to the higher oriecinal of - For the Domestic and Intemational streaming segments, marketing expenses consist primarily of advertising expenses and certain payments made to our marketing partners, including consumer cleetronics manufacturers, MVPD's, mobile operators and ISP's. Advertising expenses include promotional activities such as digital and television advertising. Marketing expenses are incurred by our Domestic and International streaming segments given our focus on building consumer awareness of the streaming offerings, and in particular our original content. Segment Results Domestic Streaming Segment As ef Year Ended December 31. members in the United Straming segment, we derive revenues from monthly membership fees for services consisting solely of streaming content to our 11% increase in avemge mom. The increase in our domestic streaming revenues was due to a 10% growth in the average number of paid memberships and an changes and plan mix. Our stand revenue per paying membership. The increase in average monthly nevenue perpaying memberhip resulted from our price The increase in domeste sthe continues to be the most popular plan choice for new memberships. new streaming content, inelic streaming cost of revenues was primanily due to a 5419.0 million increase in conteat amortization relating to our existing and processing fees and customer ser. more exclusive and oniginal prognmming. In addition, we had a $44,4 million increase in other costs, sueh as payment Nice call centers, due to our growing member base. partaen. In 2018, werketing expenses increased primanily due to an increase in advertising and public relations spending as well as increased payments to our Our Domestic strect marketing spending growth to outpace revenue growth. Our Domestic streamiag segment had a contribution margin of 37% for the year ended December 31,2017 , which inereased as compared to the spending. Year ended December 31,2016 as compared to the year ended December 31,2015