

Question
PLEASE HELP VERY URGENT Number of Instances: 506 Number of Attributes: 13 numeric/categorical predictive attribute information (in order) - CRIM per capita crime rate by
PLEASE HELP VERY URGENT
Number of Instances: 506 Number of Attributes: 13 numeric/categorical predictive attribute information (in order)
- CRIM per capita crime rate by town - ZN proportion of residential land zoned for lots over 25,000 sq.ft. - INDUS proportion of non-retail business acres per town - CHAS Charles River dummy variable (= 1 if tract bounds river; 0 otherwise) - NOX nitric oxides concentration (parts per 10 million) - RM average number of rooms per dwelling - AGE proportion of owner-occupied units built prior to 1940 - DIS weighted distances to five Boston employment centres - RAD index of accessibility to radial highways - TAX full-value property-tax rate per $10,000 - PTRATIO pupil-teacher ratio by town - B 1000(Bk - 0.63)^2 where Bk is the proportion of blacks by town - LSTAT % lower status of the population - MEDV Median value of owner-occupied homes in $1000's
The goal of this assignment is to design a Linear Regression model with ridge regularization that predicts the median value of owner-occupied homes (value in $1,000s) using the attributes for each sample.
Problem1:
In your ML experimentation, use the 2r2 measure (or coefficient of determination) as your evaluation metric. In a paragraph, describe the experimental design you will conduct to find a model that best fits the data well and is able to generalize.
- Include which parameter/s you will have control and experiment with.
- Define the general steps you will follow to train a model and draw conclusions from
Problem 2:
Which features have higher predictive value? You can use Pearson's correlation coefficient as a measure of predictive value.
- Print a correlation matrix and comment on each feature's predictive value
- Plot the scatter_matrix for each pair of variables. This may aid your analysis in step 1
Problem 3
Implement a linear regression model with ridge regularization (do NOT use library functions for this). Be sure to follow all the experimental design sets including:
- partitioning the data into training and test
- using 4-fold Cross-validation to find the best set of parameter/s
- train a final model
- evaluate performance in the test set
- draw conclusions
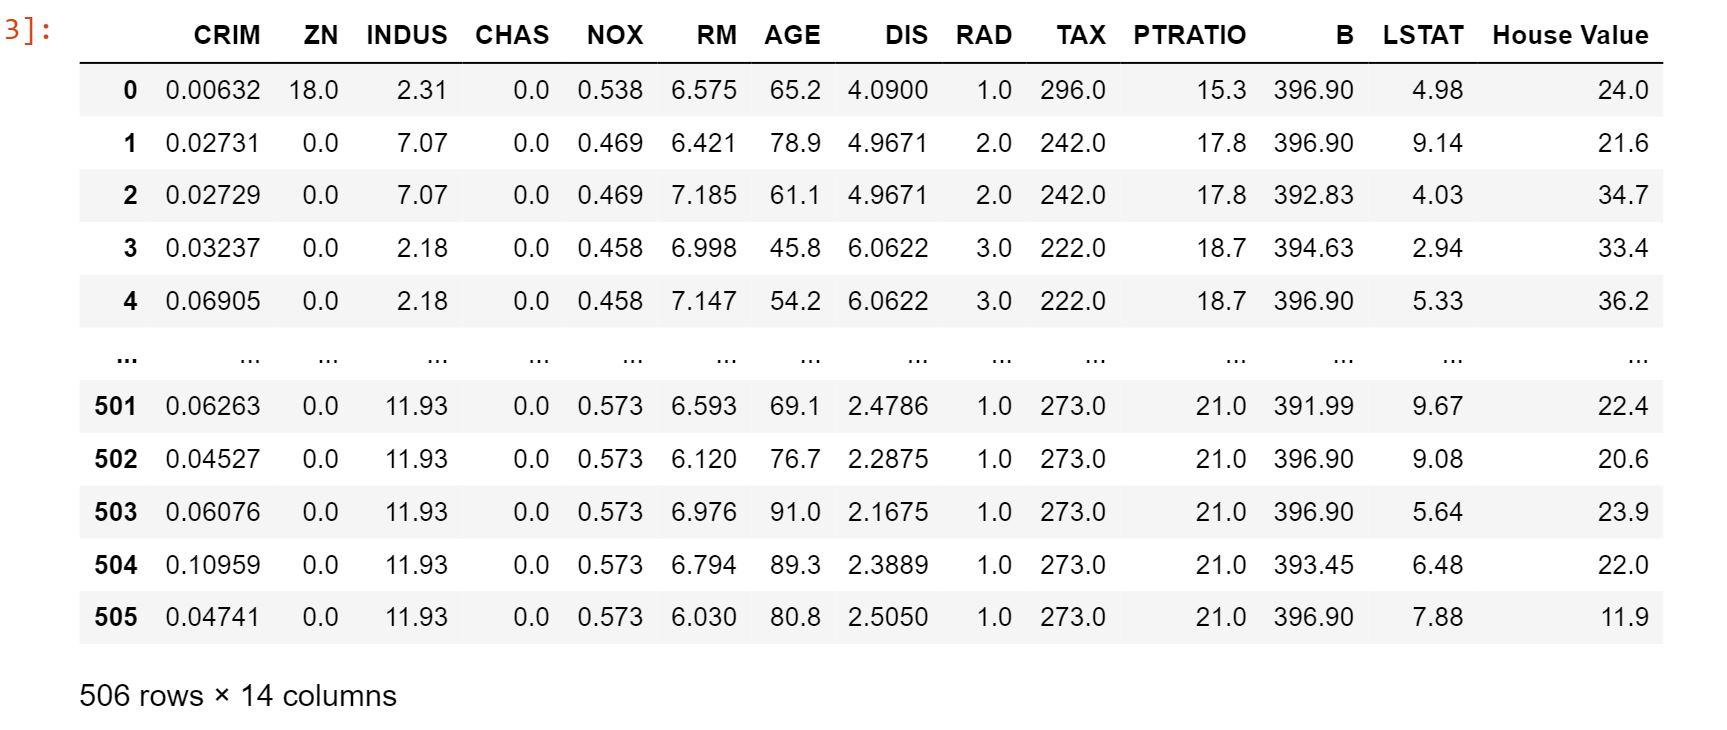
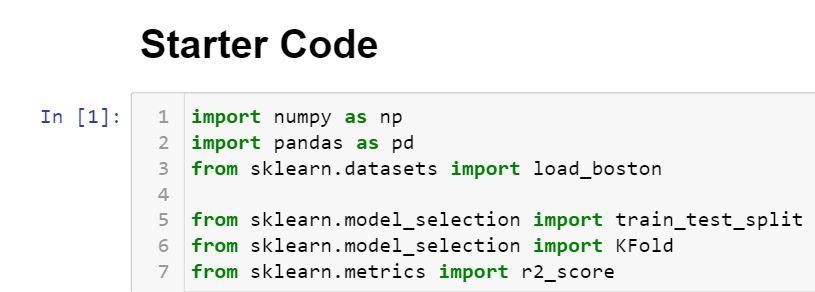
3]: CRIM ZN INDUS CHAS NOX RM AGE DIS RAD TAX PTRATIO B LSTAT House Value 0 0.00632 18.0 2.31 0.0 0.538 6.575 65.2 4.0900 1.0 296.0 15.3 396.90 4.98 24.0 1 0.02731 0.0 7.07 0.0 0.469 6.421 78.9 4.9671 2.0 242.0 17.8 396.90 9.14 21.6 2 0.02729 0.0 7.07 0.0 0.469 7.185 61.1 4.9671 2.0 242.0 17.8 392.83 4.03 34.7 3 0.03237 0.0 2.18 0.0 0.458 6.998 45.8 6.0622 3.0 222.0 18.7 394.63 2.94 33.4 4 0.06905 0.0 2.18 0.0 0.458 7.147 54.2 6.0622 3.0 222.0 18.7 396.90 5.33 36.2 ... .. 501 0.06263 0.0 11.93 0.0 0.573 6.593 69.1 2.4786 1.0 273.0 21.0 391.99 9.67 22.4 502 0.04527 0.0 11.93 0.0 0.573 6.120 76.7 2.2875 1.0 273.0 21.0 396.90 9.08 20.6 503 0.06076 0.0 11.93 0.0 0.573 6.976 91.0 2.1675 1.0 273.0 21.0 396.90 5.64 23.9 504 0.10959 0.0 11.93 0.0 0.573 6.794 89.3 2.3889 1.0 273.0 21.0 393.45 6.48 22.0 505 0.04741 0.0 11.93 0.0 0.573 6.030 80.8 2.5050 1.0 273.0 21.0 396.90 7.88 11.9 506 rows x 14 columns Starter Code In [1]: 1 import numpy as np 2 import pandas as pd 3 from sklearn.datasets import load_boston 4 from sklearn.model_selection import train_test_split from sklearn.model_selection import KFold 7 from sklearn.metrics import r2_score 3]: CRIM ZN INDUS CHAS NOX RM AGE DIS RAD TAX PTRATIO B LSTAT House Value 0 0.00632 18.0 2.31 0.0 0.538 6.575 65.2 4.0900 1.0 296.0 15.3 396.90 4.98 24.0 1 0.02731 0.0 7.07 0.0 0.469 6.421 78.9 4.9671 2.0 242.0 17.8 396.90 9.14 21.6 2 0.02729 0.0 7.07 0.0 0.469 7.185 61.1 4.9671 2.0 242.0 17.8 392.83 4.03 34.7 3 0.03237 0.0 2.18 0.0 0.458 6.998 45.8 6.0622 3.0 222.0 18.7 394.63 2.94 33.4 4 0.06905 0.0 2.18 0.0 0.458 7.147 54.2 6.0622 3.0 222.0 18.7 396.90 5.33 36.2 ... .. 501 0.06263 0.0 11.93 0.0 0.573 6.593 69.1 2.4786 1.0 273.0 21.0 391.99 9.67 22.4 502 0.04527 0.0 11.93 0.0 0.573 6.120 76.7 2.2875 1.0 273.0 21.0 396.90 9.08 20.6 503 0.06076 0.0 11.93 0.0 0.573 6.976 91.0 2.1675 1.0 273.0 21.0 396.90 5.64 23.9 504 0.10959 0.0 11.93 0.0 0.573 6.794 89.3 2.3889 1.0 273.0 21.0 393.45 6.48 22.0 505 0.04741 0.0 11.93 0.0 0.573 6.030 80.8 2.5050 1.0 273.0 21.0 396.90 7.88 11.9 506 rows x 14 columns Starter Code In [1]: 1 import numpy as np 2 import pandas as pd 3 from sklearn.datasets import load_boston 4 from sklearn.model_selection import train_test_split from sklearn.model_selection import KFold 7 from sklearn.metrics import r2_score
Step by Step Solution
There are 3 Steps involved in it
Step: 1

Get Instant Access to Expert-Tailored Solutions
See step-by-step solutions with expert insights and AI powered tools for academic success
Step: 2

Step: 3
Ace Your Homework with AI
Get the answers you need in no time with our AI-driven, step-by-step assistance
Get Started
Database Concepts
Authors: David Kroenke, David Auer, Scott Vandenberg, Robert Yoder
9th Edition
0135188148, 978-0135188149, 9781642087611