Please help! When it asks for the observed probability value what would that be? I need help on all these questions. For 3# would my N value be 12 or 11? because one person didn't do the test.
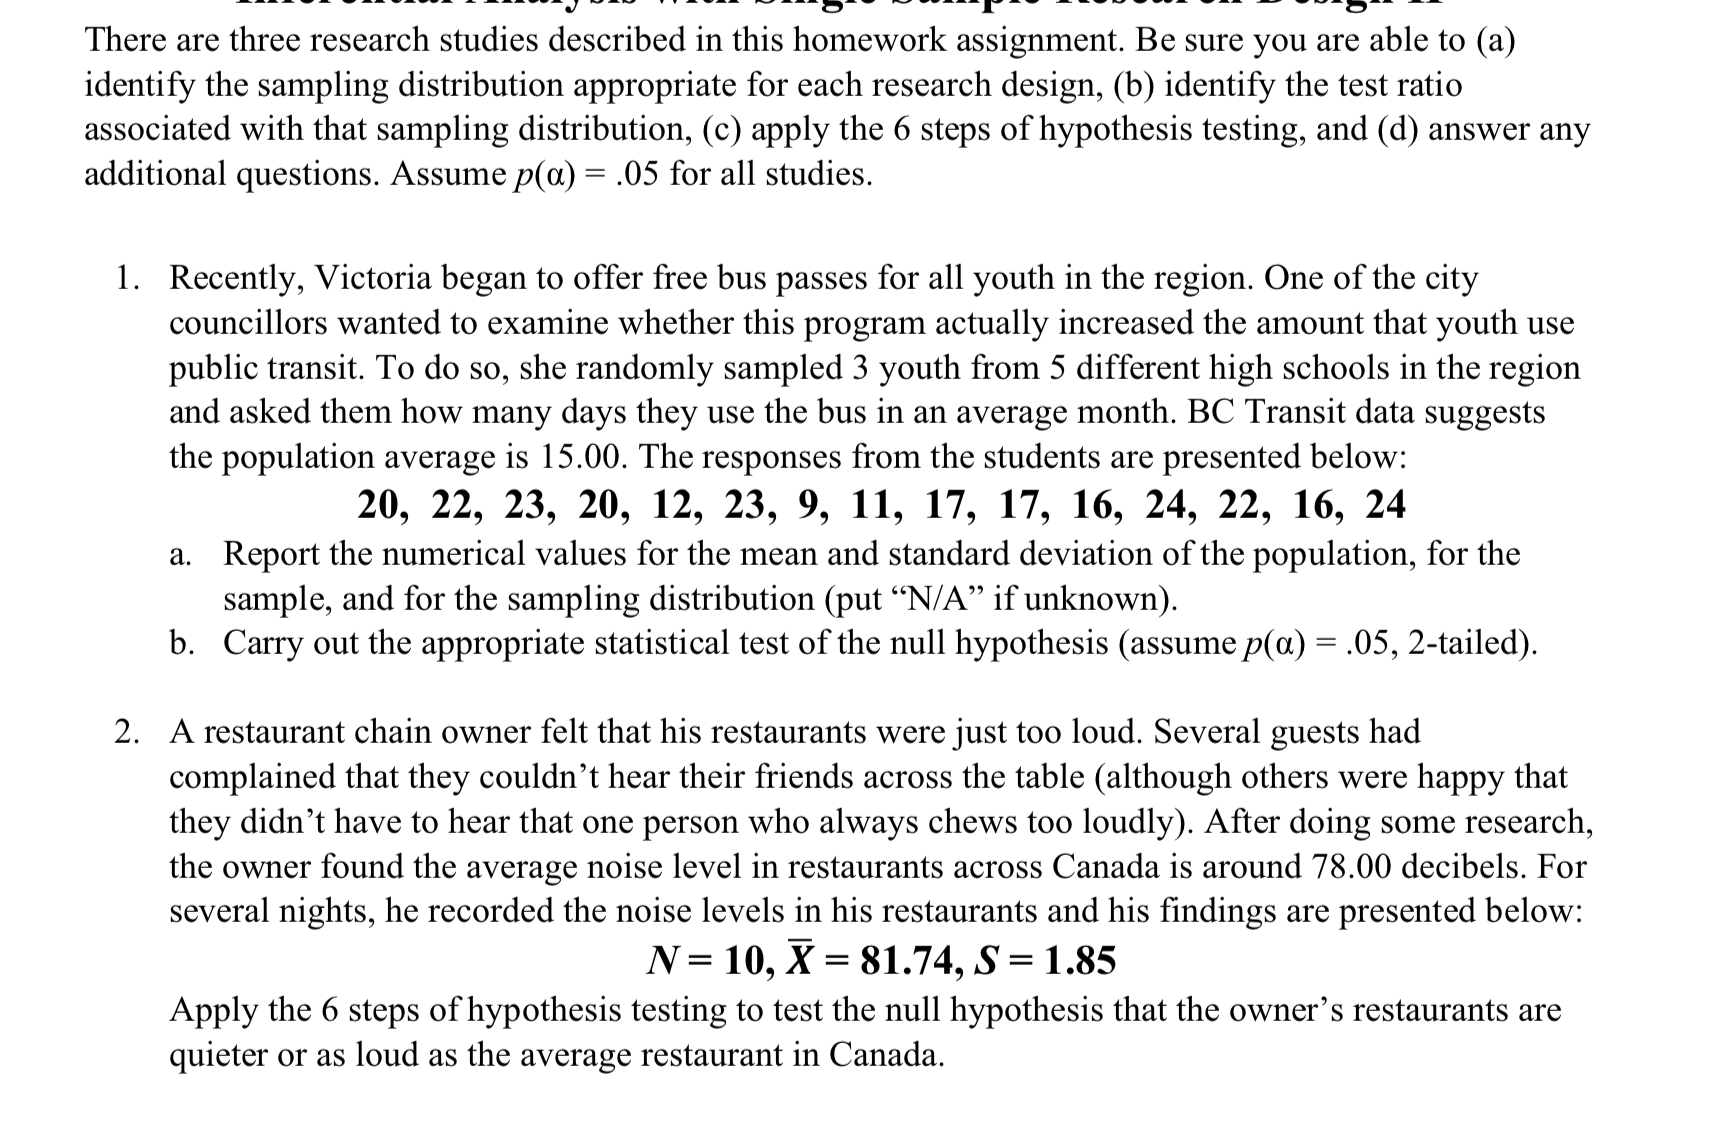
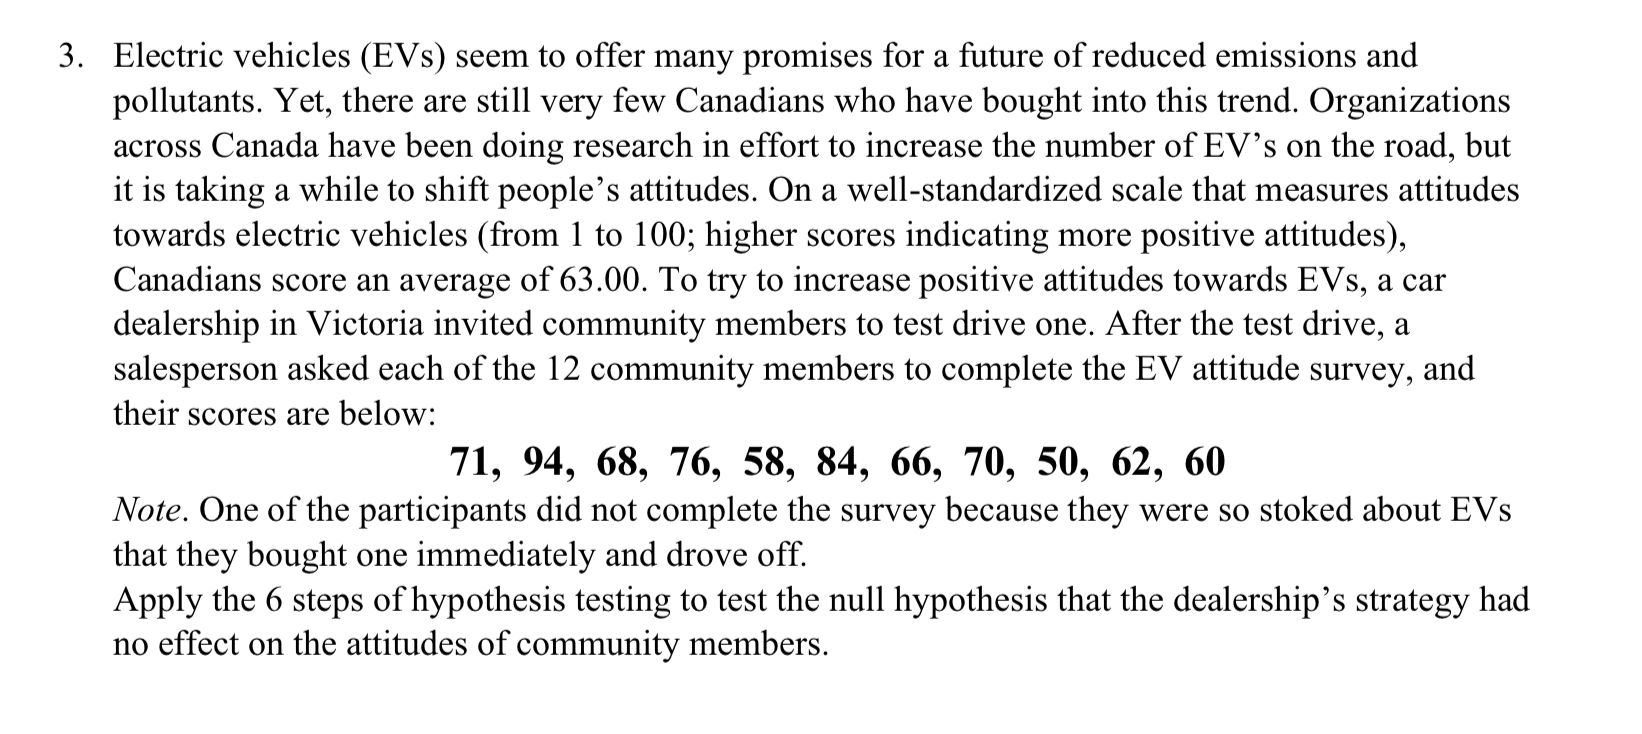
There are three research studies described in this homework assignment. Be sure you are able to (a) identify the sampling distribution appropriate for each research design, (b) identify the test ratio associated with that sampling distribution, (c) apply the 6 steps of hypothesis testing, and (d) answer any additional questions. Assume p(a) = .05 for all studies. 1. Recently, Victoria began to offer free bus passes for all youth in the region. One of the city councillors wanted to examine whether this program actually increased the amount that youth use public transit. To do so, she randomly sampled 3 youth from 5 different high schools in the region and asked them how many days they use the bus in an average month. BC Transit data suggests the population average is 15.00. The responses from the students are presented below: 20, 22, 23, 20, 12, 23, 9, 11, 17, 17, 16, 24, 22, 16, 24 a. Report the numerical values for the mean and standard deviation of the population, for the sample, and for the sampling distribution (put "N/A" if unknown). b. Carry out the appropriate statistical test of the null hypothesis (assume p(a) = .05, 2-tailed). 2. A restaurant chain owner felt that his restaurants were just too loud. Several guests had complained that they couldn't hear their friends across the table (although others were happy that they didn't have to hear that one person who always chews too loudly). After doing some research, the owner found the average noise level in restaurants across Canada is around 78.00 decibels. For several nights, he recorded the noise levels in his restaurants and his findings are presented below: N = 10, X = 81.74, S = 1.85 Apply the 6 steps of hypothesis testing to test the null hypothesis that the owner's restaurants are quieter or as loud as the average restaurant in Canada.3. Electric vehicles (EVs) seem to offer many promises for a future of reduced emissions and pollutants. Yet, there are still very few Canadians who have bought into this trend. Organizations across Canada have been doing research in effort to increase the number of EV's on the road, but it is taking a while to shift people's attitudes. On a well-standardized scale that measures attitudes towards electric vehicles (from 1 to 100; higher scores indicating more positive attitudes), Canadians score an average of 63.00. To try to increase positive attitudes towards EVs, a car dealership in Victoria invited community members to test drive one. After the test drive, a salesperson asked each of the 12 community members to complete the EV attitude survey, and their scores are below: 71, 94, 68, 76, 58, 84, 66, 70, 50, 62, 60 Note. One of the participants did not complete the survey because they were so stoked about EVs that they bought one immediately and drove off. Apply the 6 steps of hypothesis testing to test the null hypothesis that the dealership's strategy had no effect on the attitudes of community members


