Answered step by step
Verified Expert Solution
Link Copied!

Question

1 Approved Answer

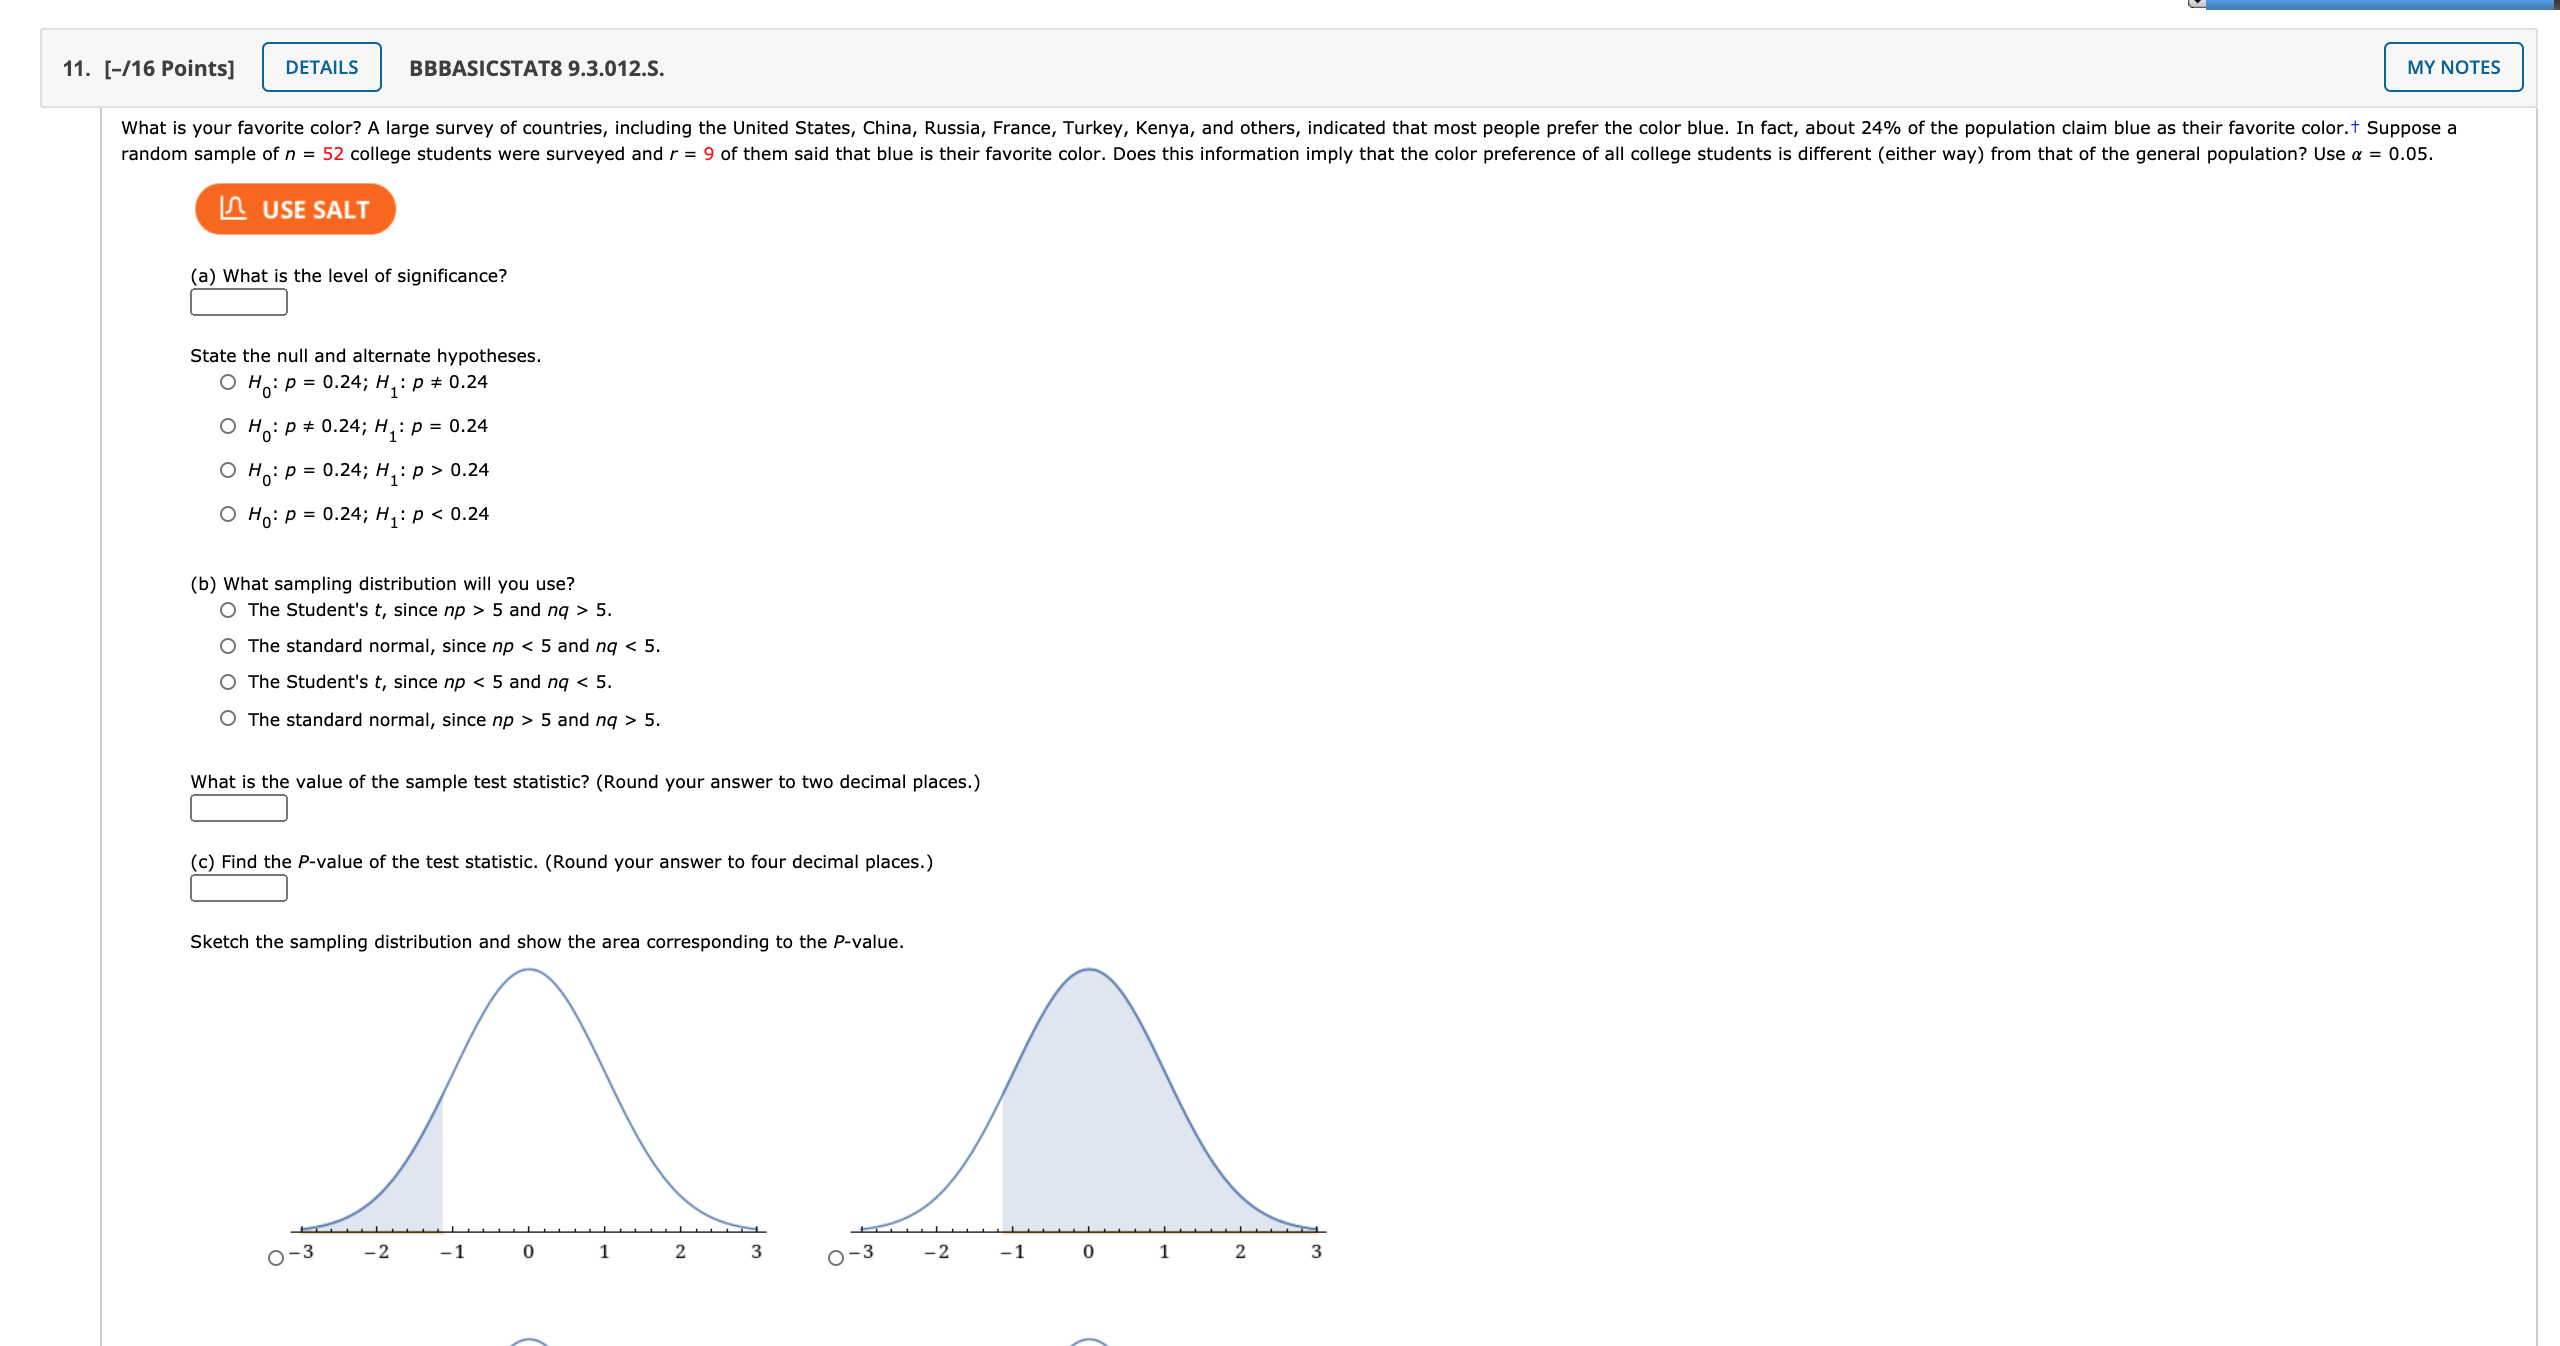
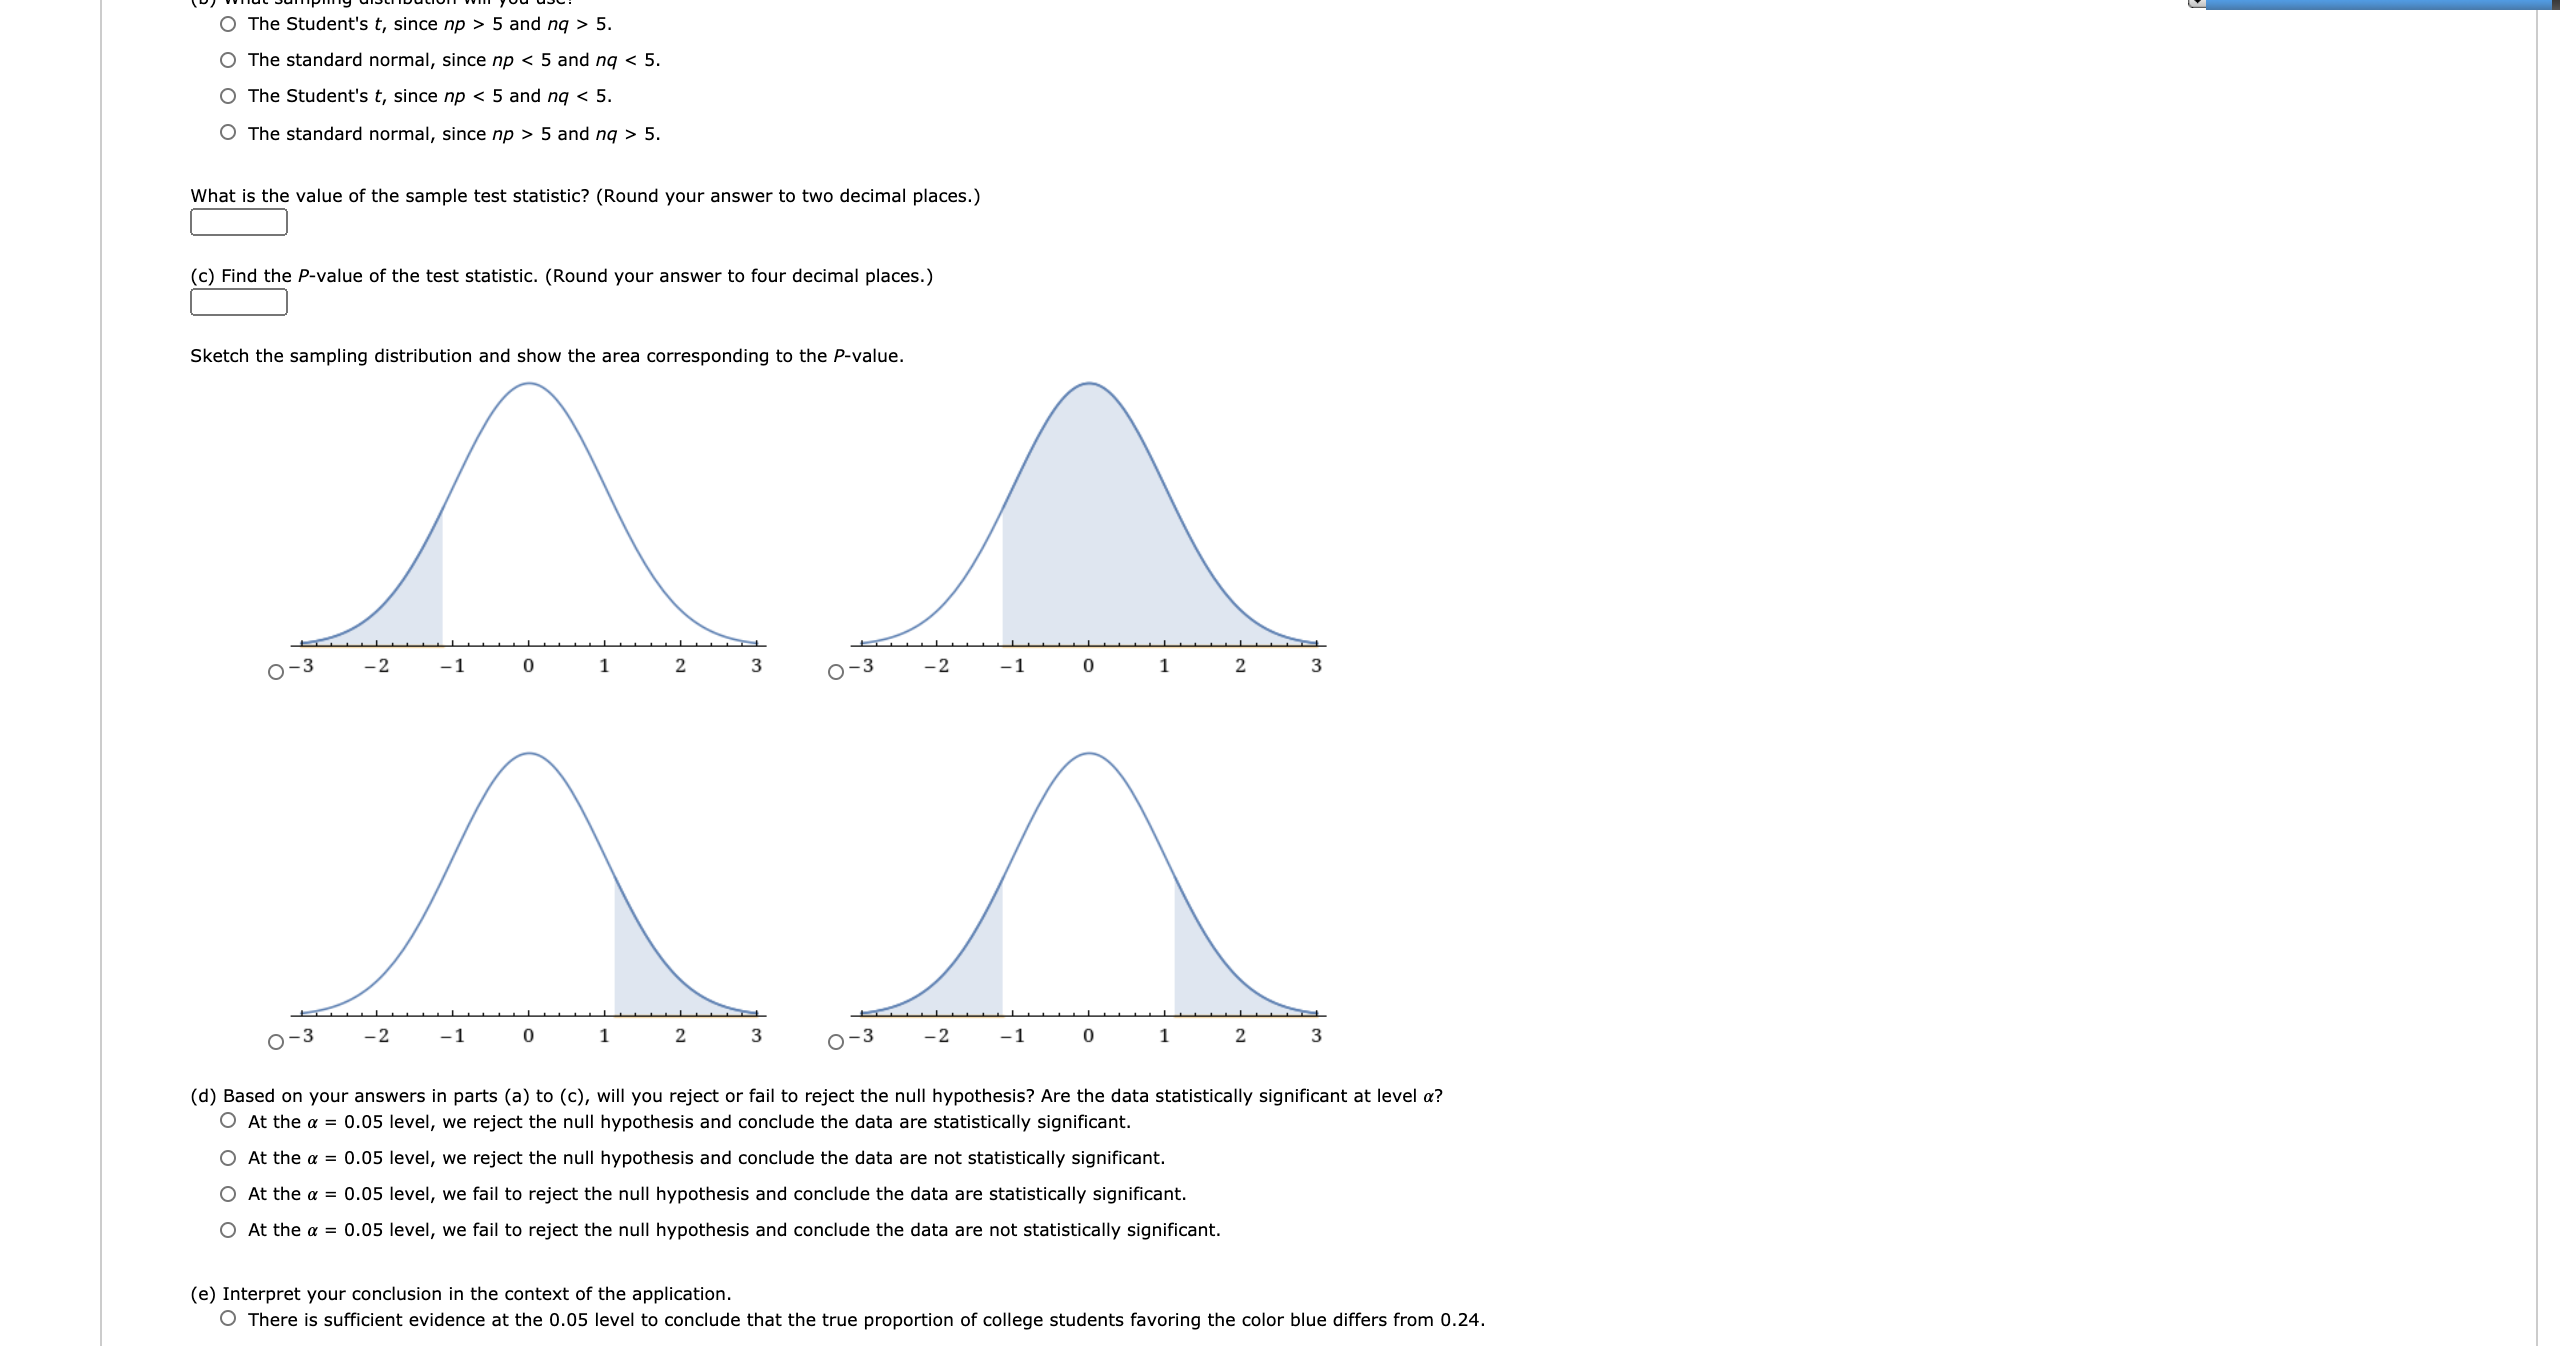
Please help with 11 ae 11. [-/16 Points] DETAILS BBBASICSTAT8 9 MY NOTES What is your favorite color? A large survey of countries, including the

Please help with 11 ae

image text in transcribedimage text in transcribed
11. [-/16 Points] DETAILS BBBASICSTAT8 9 MY NOTES What is your favorite color? A large survey of countries, including the United States, China, Russia, France, Turkey, Kenya, and others, indicated that most people prefer the color blue. In fact, about 24% of the population claim blue as their favorite color. Suppose a random sample of n = 52 college students were surveyed and r = 9 of them said that blue is their favorite color. Does this information imply that the color preference of all college students is different (either way) from that of the general population? Use a = 0.05. LA USE SALT (a) What is the level of significance? State the null and alternate hypotheses. OH : p = 0.24; H,: p # 0.24 OH: P # 0.24; H, : p = 0.24 O Ho: P = 0.24; H : p > 0.24 O Ho: P = 0.24; H1: p 5 and nq > 5. O The standard normal, since np 5 and nq > 5. What is the value of the sample test statistic? (Round your answer to two decimal places.) (c) Find the P-value of the test statistic. (Round your answer to four decimal places.) Sketch the sampling distribution and show the area corresponding to the P-value. 0-3 -2 -1 0 2 0 -3 -2 -1 0 2.c, ....... .......,...., -..........c.. 0 The Student's 1', since np > 5 and rlq > 5. o The standard normal, since np 5 and H47 > 5. What is the value the sample test statistic? (Round your answer to two decimal places.) (c) Find the Pvalue of the test statistic. (Round your answer to four decimal places.) Sketch the sampling distribution and show the area corresponding to the Pvalue. 03 -2 1 0 1 2 3 0-3 2 1 0 1 2 3 03 2 1 0 1 2 3 03 2 1 O 1 2 3 (d) Based on your answers in parts (a) to (c), will you reject or fail to reject the null hypothesis? Are the data statistically signicant at level a? 0 At the a = 0.05 level, we reject the null hypothesis and conclude the data are statistically signicant. 0 At the or = 0.05 level, we reject the null hypothesis and conclude the data are not statistically signicant. 0 At the a = 0.05 level, we fail to reject me null hypomesis and conclude the data are statistically signicant. 0 At the a = 0.05 level, we fail to reject the null hypothesis and conclude the data are not statistically signicant. (e) Interpret your conclusion in the context of the application. 0 There is sufcient evidence at the 0.05 level to conclude that the hue proportion of college students favoring the color blue differs from 0,24

Step by Step Solution

There are 3 Steps involved in it

Step: 1

blur-text-image

Get Instant Access to Expert-Tailored Solutions

See step-by-step solutions with expert insights and AI powered tools for academic success

Step: 2

blur-text-image

Step: 3

blur-text-image

Ace Your Homework with AI

Get the answers you need in no time with our AI-driven, step-by-step assistance

Get Started

Recommended Textbook for

Holt Mcdougal Larson Algebra 2

Authors: HOLT MCDOUGAL

1st Edition 2012

9780547647159, 0547647158

More Books

Students also viewed these Mathematics questions

Question

Explain the various collection policies in receivables management.

Answered: 1 week ago

Question

What are the main objectives of Inventory ?

Answered: 1 week ago

Question

Explain the various inventory management techniques in detail.

Answered: 1 week ago