Please help with all four parts
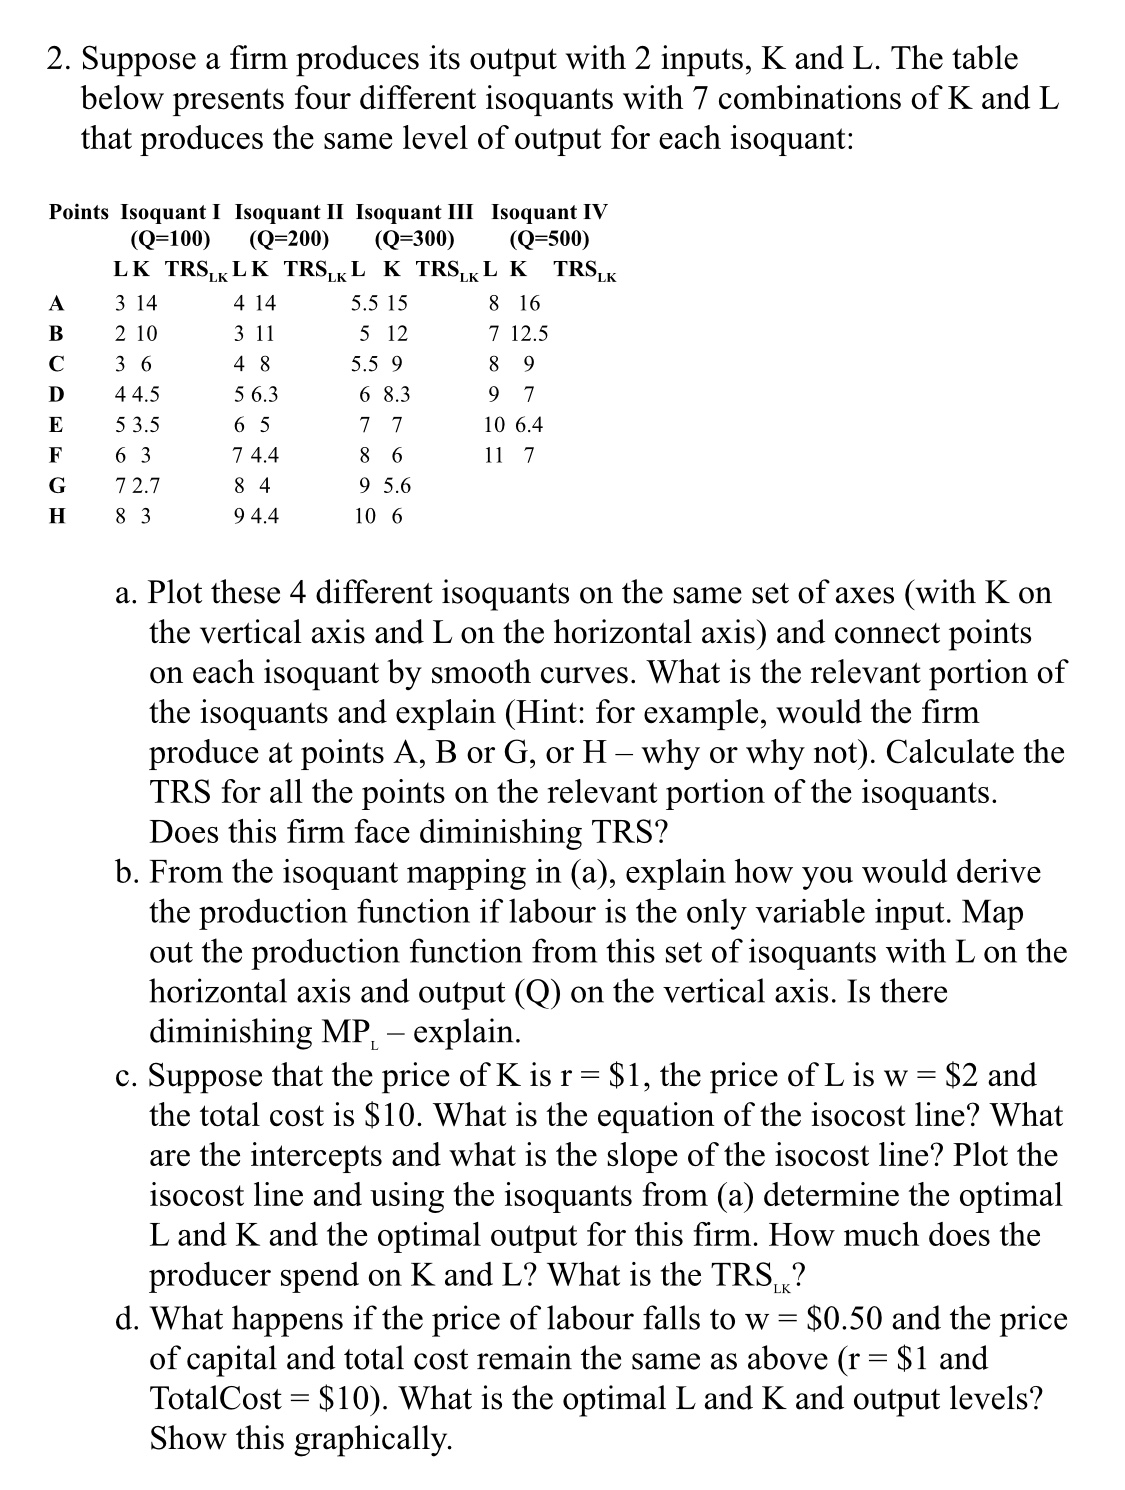
2. Suppose a rm produces its output with 2 inputs, K and L. The table below presents four different isoquants with 7 combinations of K and L that produces the same level of output for each isoquant: Points Isoquant I Isoquant II Isoquant Ill Isoquant IV EOHUOUIb (Q=10{|) (0:200) (Q=300) (Q=500) LK TRSLKLK TRSLKL K TRSLKL K TrisLK 3 14 414 5.515 8 l6 2 10 3 ll 5 12 7 12.5 3 6 4 8 5.5 9 8 9 44.5 56.3 6 8.3 9 \"r' 53.5 6 5 7 7 10 6.4 6 3 ?4.4 8 6 ll 7 72.? 8 4 9 5.6 8 3 94.4 10 6 a. Plot these 4 different isoquants on the same set of axes (with K on the vertical axis and L on the horizontal axis) and connect points on each isoquant by smooth curves. What is the relevant portion of the isoquants and explain (Hint: for example, would the rm produce at points A, B or G, or H why or why not). Calculate the TRS for all the points on the relevant portion of the isoquants. Does this rm face diminishing TRS? . From the isoquant mapping in (a), explain how you would derive the production function if labour is the only variable input. Map out the production function from this set of isoquants with L on the horizontal axis and output (Q) on the vertical axis. Is there diminishing MPL explain. . Suppose that the price of K is r = $1, the price of L is w = $2 and the total cost is $10. What is the equation of the isocost line? What are the intercepts and what is the slope of the isocost line? Plot the isocost line and using the isoquants from (a) determine the optimal L and K and the optimal output for this rm. How much does the producer spend on K and L? What is the TRSLK? d. What happens if the price of labour falls to w = $0.50 and the price of capital and total cost remain the same as above (r = $1 and TotalCost = $10). What is the optimal L and K and output levels? Show this graphically