Please help with all parts. Thank you so much! Q 1. Following are the published weights (in pounds) of all of the team members of
Please help with all parts. Thank you so much!
Q 1.
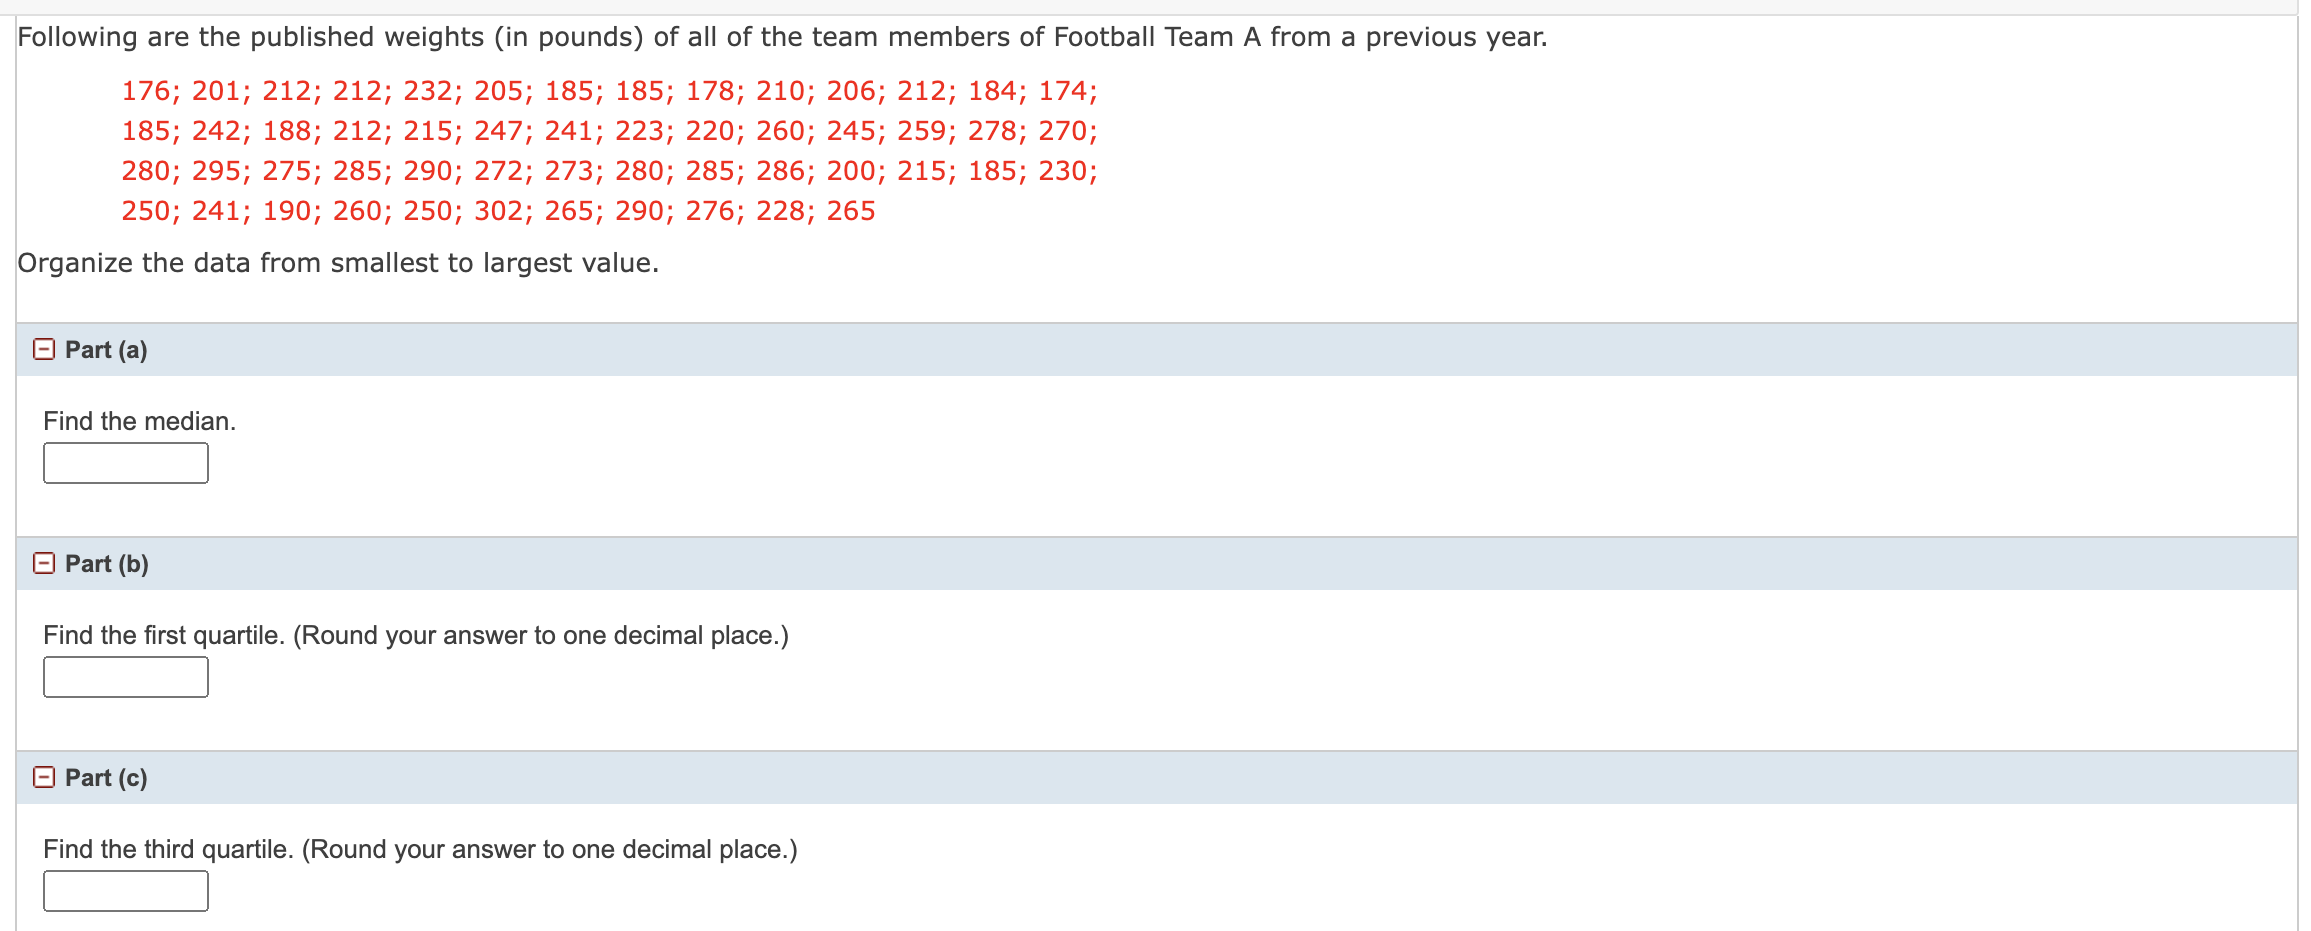
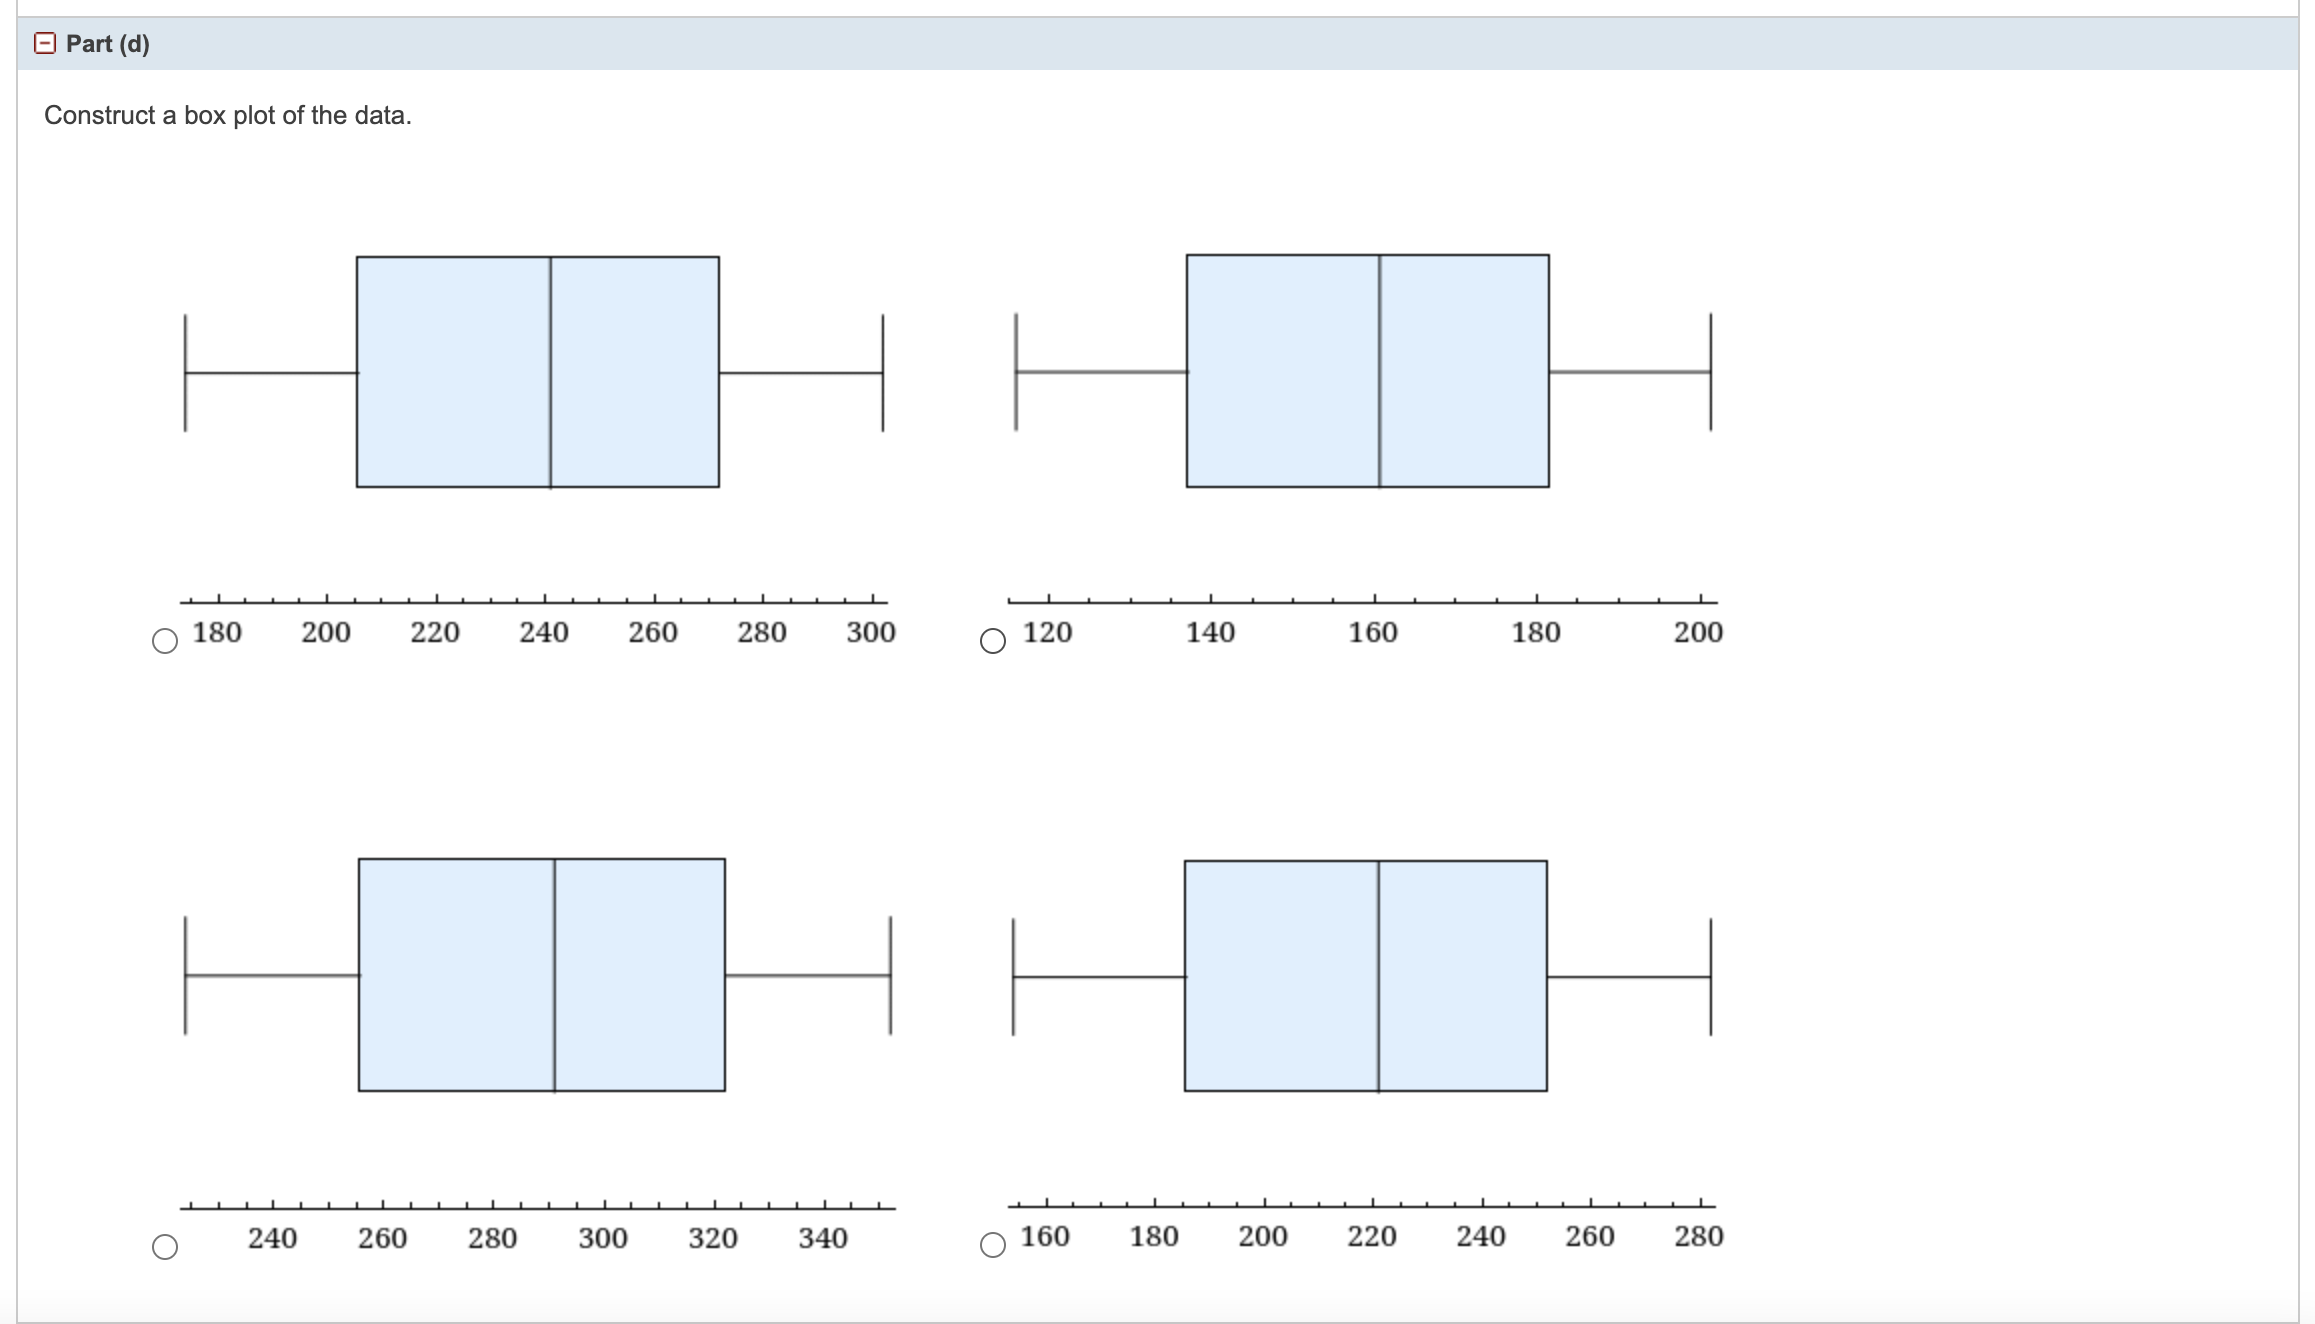
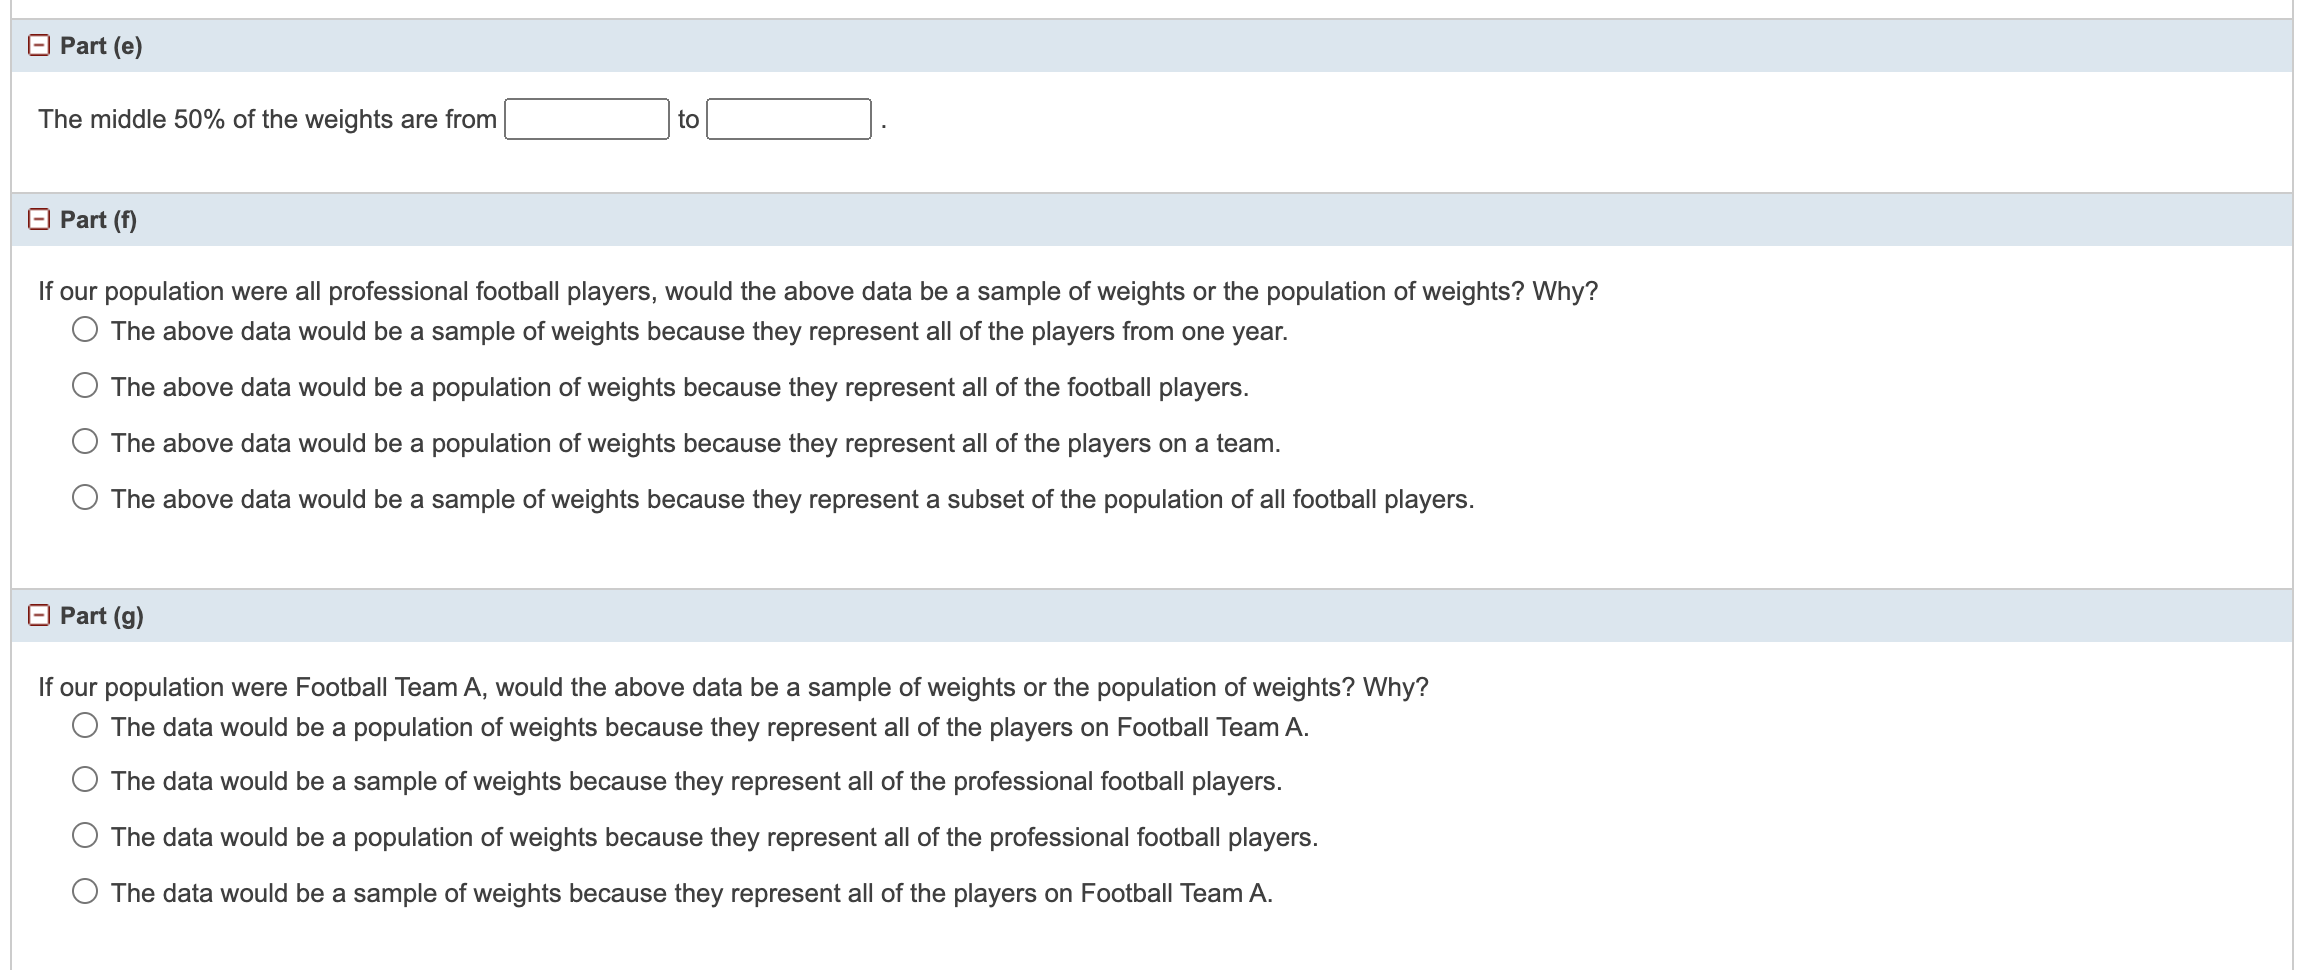
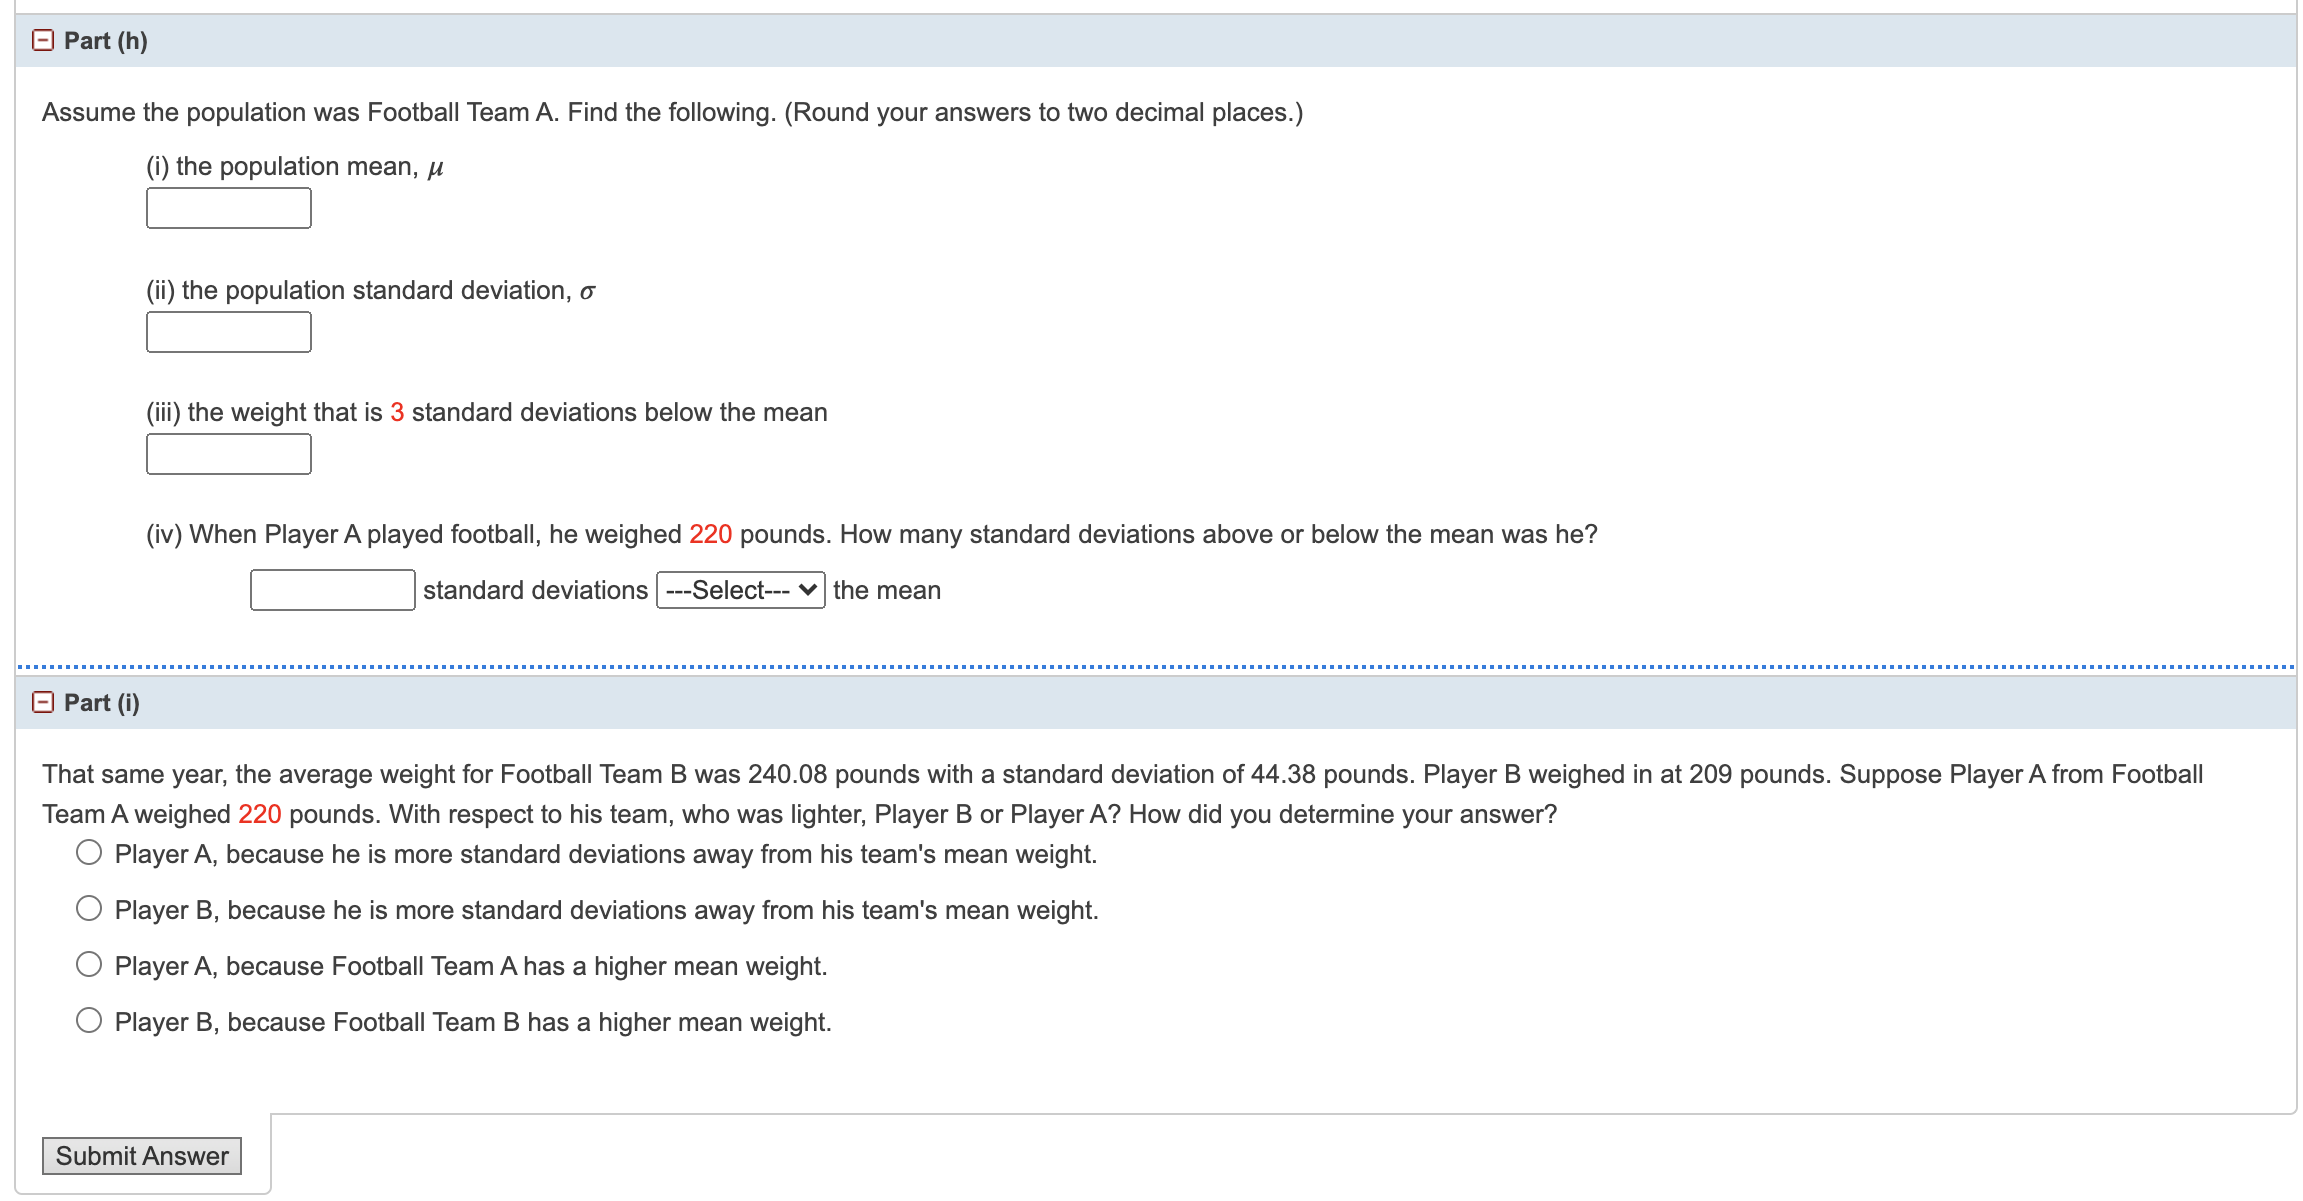
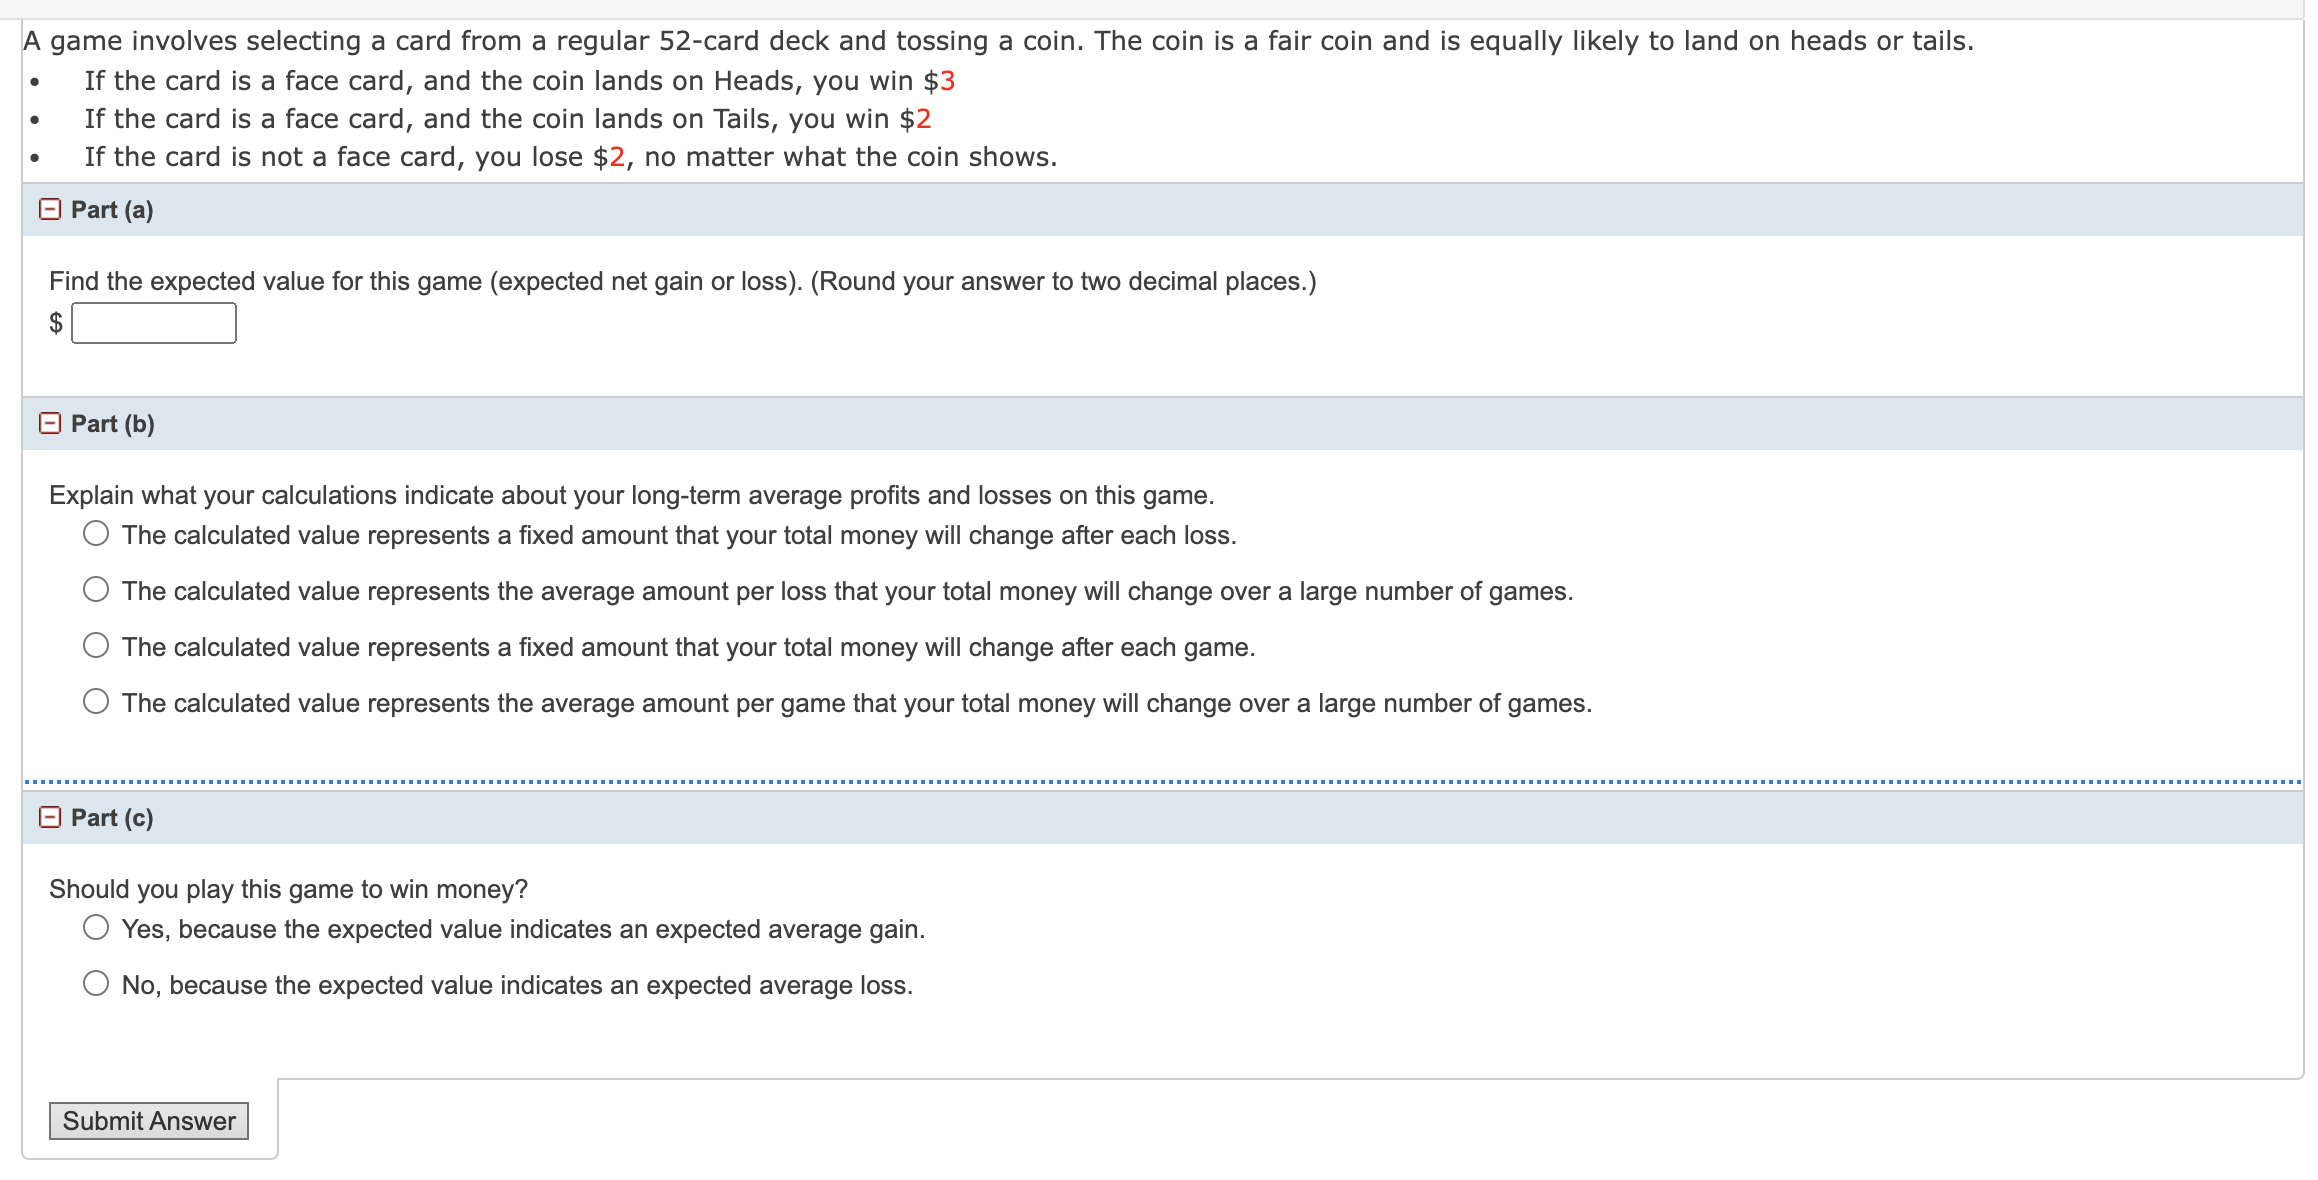
Following are the published weights (in pounds) of all of the team members of Football Team A from a previous year. 176; 201; 212; 212; 232; 205; 185; 185; 178; 210; 206; 212; 184; 174; 185; 242; 188; 212; 215; 247; 241; 223; 220; 260; 245; 259; 278; 270; 280; 295; 275; 285; 290; 272; 273; 280; 285; 286; 200; 215; 185; 230; 250; 241; 190; 260; 250; 302; 265; 290; 276; 228; 265 Organize the data from smallest to largest value. Find the median. Find the rst quartile. (Round your answer to one decimal place.) Find the third quartile. (Round your answer to one decimal place.) \f- Part (e) The middle 50% of the weights are from to - Part (f) If our population were all professional football players, would the above data be a sample of weights or the population of weights? Why? 0 The above data would be a sample of weights because they represent all of the players from one year. 0 The above data would be a population of weights because they represent all of the football players. 0 The above data would be a population of weights because they represent all of the players on a team. 0 The above data would be a sample of weights because they represent a subset of the population of all football players. - Part (9) If our population were Football Team A, would the above data be a sample of weights or the population of weights? Why? 0 The data would be a population of weights because they represent all of the players on Football Team A. O The data would be a sample of weights because they represent all of the professional football players. 0 The data would be a population of weights because they represent all of the professional football players. 0 The data would be a sample of weights because they represent all of the players on Football Team A. - Part (h) Assume the population was Football Team A. Find the following. (Round your answers to two decimal places.) (i)the population mean, [4 (ii) the population standard deviation, 6 (iii) the weight that is 3 standard deviations below the mean (iv) When PlayerAplayed football, he weighed 220 pounds. How many standard deviations above or below the mean was he? standard deviations --Select--- V the mean - Part (i) That same year, the average weight for Football Team B was 240.08 pounds with a standard deviation of 44.38 pounds. Player B weighed in at 209 pounds. Suppose PlayerAfrom Football Team Aweighed 220 pounds. With respect to his team, who was lighter, Player B or Player A? How did you determine your answer? 0 Player A, because he is more standard deviations away from his team's mean weight. 0 Player B, because he is more standard deviations away from his team's mean weight. 0 Player A, because Football Team A has a higher mean weight. 0 Player B, because Football Team B has a higher mean weight. Submit Answer A game involves selecting a card from a regular SZ-card deck and tossing a coin. The coin is a fair coin and is equally likely to land on heads or tails. . If the card is a face card, and the coin lands on Heads, you win $3 . If the card is a face card, and the coin lands on Tails, you win $2 - If the card is not a face card, you lose $2, no matter what the coin shows. El Part (a) Find the expected value for this game (expected net gain or loss). (Round your answer to two decimal places.) $: El Part (b) Explain what your calculations indicate about your long-term average prots and losses on this game. 0 The calculated value represents a xed amount that your total money will change after each loss. 0 The calculated value represents the average amount per loss that your total money will change over a large number of games. 0 The calculated value represents a xed amount that your total money will change after each game. 0 The calculated value represents the average amount per game that your total money will change over a large number of games. Should you play this game to win money? 0 Yes, because the expected value indicates an expected average gain. 0 No, because the expected value indicates an expected average loss. Submit
Step by Step Solution
There are 3 Steps involved in it
Step: 1
Get Instant Access to Expert-Tailored Solutions
See step-by-step solutions with expert insights and AI powered tools for academic success
Step: 2
Step: 3
Ace Your Homework with AI
Get the answers you need in no time with our AI-driven, step-by-step assistance