Answered step by step
Verified Expert Solution
Question
1 Approved Answer
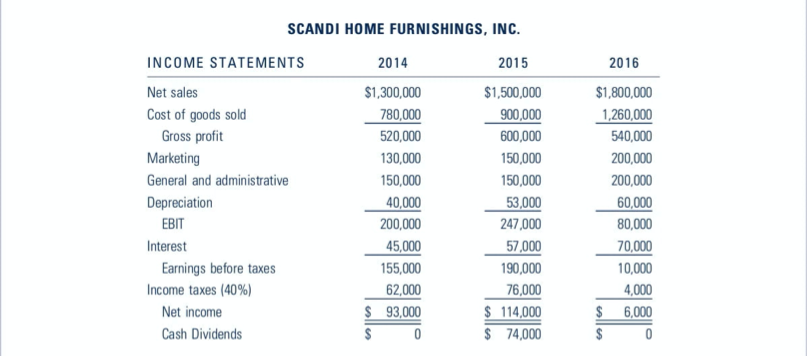
Please help with all questions. SCANDI HOME FURNISHINGS, INC. INCOME STATEMENTS 2014 2015 Net sales $1,300,000 $1,500,000 Cost of goods sold 780,000 900,000 Gross profit


Please help with all questions.
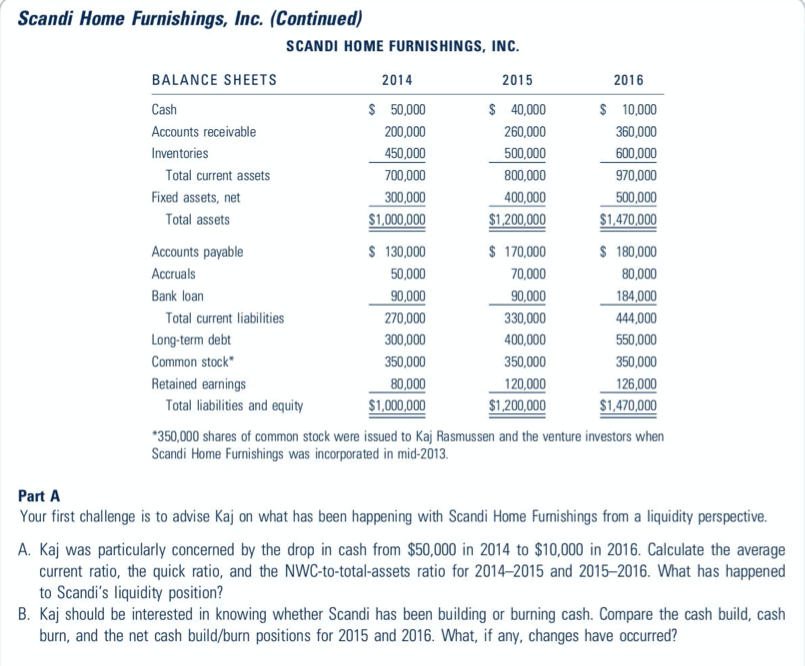
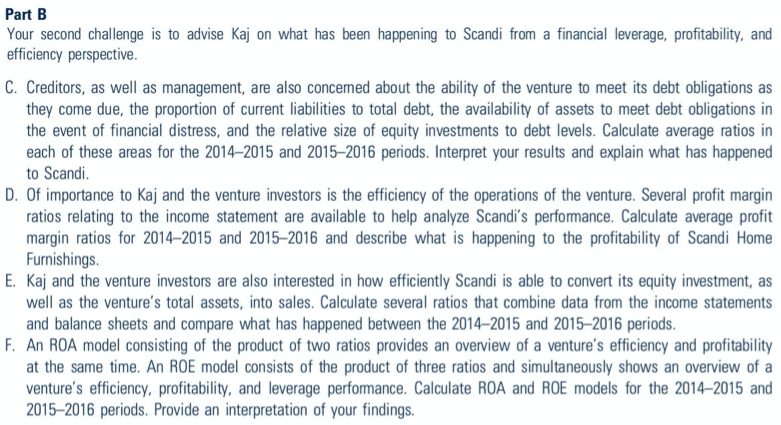
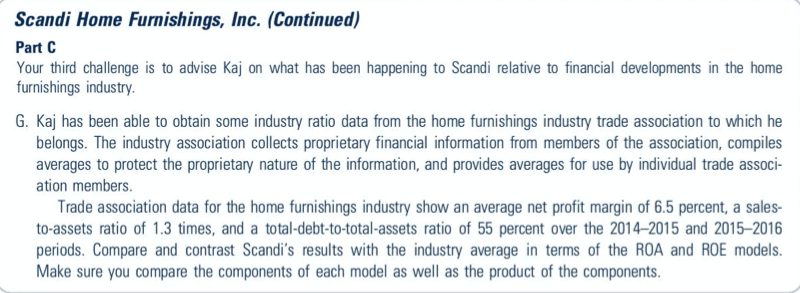
SCANDI HOME FURNISHINGS, INC. INCOME STATEMENTS 2014 2015 Net sales $1,300,000 $1,500,000 Cost of goods sold 780,000 900,000 Gross profit 520,000 600,000 Marketing 130,000 150,000 General and administrative 150,000 150,000 Depreciation 40,000 53,000 EBIT 200,000 247,000 Interest 45,000 57,000 Earnings before taxes 155,000 190,000 Income taxes (40%) 62,000 76,000 Net income $ 93,000 $ 114,000 Cash Dividends $ 0 $ 74,000 2016 $1,800,000 1,260,000 540,000 200,000 200,000 60,000 80,000 70,000 10,000 4,000 $ 6,000 $ 0 Scandi Home Furnishings, Inc. (Continued) SCANDI HOME FURNISHINGS, INC. BALANCE SHEETS 2014 2015 2016 Cash $ 50,000 $ 40,000 $ 10,000 Accounts receivable 200,000 260,000 360,000 Inventories 450,000 500,000 600,000 Total current assets 700,000 800,000 970,000 Fixed assets, net 300,000 400,000 500,000 Total assets $1,000,000 $1,200,000 $1,470,000 Accounts payable $ 130,000 $ 170,000 $ 180,000 Accruals 50,000 70,000 80,000 Bank loan 90,000 90,000 184,000 Total current liabilities 270,000 330,000 444,000 Long-term debt 300,000 400,000 550,000 Common stock* 350,000 350,000 350,000 Retained earnings 80,000 120,000 126,000 Total liabilities and equity $1,000,000 $1,200,000 $1,470,000 *350,000 shares of common stock were issued to Kaj Rasmussen and the venture investors when Scandi Home Furnishings was incorporated in mid-2013. Part A Your first challenge is to advise Kaj on what has been happening with Scandi Home Furnishings from a liquidity perspective. A. Kaj was particularly concerned by the drop in cash from $50,000 in 2014 to $10,000 in 2016. Calculate the average current ratio, the quick ratio, and the NWC-to-total-assets ratio for 20142015 and 20152016. What has happened to Scandi's liquidity position? B. Kaj should be interested in knowing whether Scandi has been building or burning cash. Compare the cash build, cash burn, and the net cash build/burn positions for 2015 and 2016. What, if any, changes have occurred? Part B Your second challenge is to advise Kaj on what has been happening to Scandi from a financial leverage, profitability, and efficiency perspective. C. Creditors, as well as management, are also concerned about the ability of the venture to meet its debt obligations as they come due, the proportion of current liabilities to total debt, the availability of assets to meet debt obligations in the event of financial distress, and the relative size of equity investments to debt levels. Calculate average ratios in each of these areas for the 2014-2015 and 2015-2016 periods. Interpret your results and explain what has happened to Scandi. D. Of importance to Kaj and the venture investors is the efficiency of the operations of the venture. Several profit margin ratios relating to the income statement are available to help analyze Scandi's performance. Calculate average profit margin ratios for 2014-2015 and 2015-2016 and describe what is happening to the profitability of Scandi Home Furnishings. E. Kaj and the venture investors are also interested in how efficiently Scandi is able to convert its equity investment, as well as the venture's total assets, into sales. Calculate several ratios that combine data from the income statements and balance sheets and compare what has happened between the 2014-2015 and 20152016 periods. F. An ROA model consisting of the product of two ratios provides an overview of a venture's efficiency and profitability at the same time. An ROE model consists of the product of three ratios and simultaneously shows an overview of a venture's efficiency, profitability, and leverage performance. Calculate ROA and ROE models for the 2014-2015 and 2015-2016 periods. Provide an interpretation of your findings. Scandi Home Furnishings, Inc. (Continued) Part C Your third challenge is to advise Kaj on what has been happening to Scandi relative to financial developments in the home furnishings industry. G. Kaj has been able to obtain some industry ratio data from the home furnishings industry trade association to which he belongs. The industry association collects proprietary financial information from members of the association, compiles averages to protect the proprietary nature of the information, and provides averages for use by individual trade associ- ation members. Trade association data for the home furnishings industry show an average net profit margin of 6.5 percent, a sales- to-assets ratio of 1.3 times, and a total-debt-to-total-assets ratio of 55 percent over the 20142015 and 2015-2016 periods. Compare and contrast Scandi's results with the industry average in terms of the ROA and ROE models. Make sure you compare the components of each model as well as the product of the componentsStep by Step Solution
There are 3 Steps involved in it
Step: 1

Get Instant Access to Expert-Tailored Solutions
See step-by-step solutions with expert insights and AI powered tools for academic success
Step: 2

Step: 3

Ace Your Homework with AI
Get the answers you need in no time with our AI-driven, step-by-step assistance
Get Started


