Answered step by step
Verified Expert Solution
Link Copied!

Question

1 Approved Answer

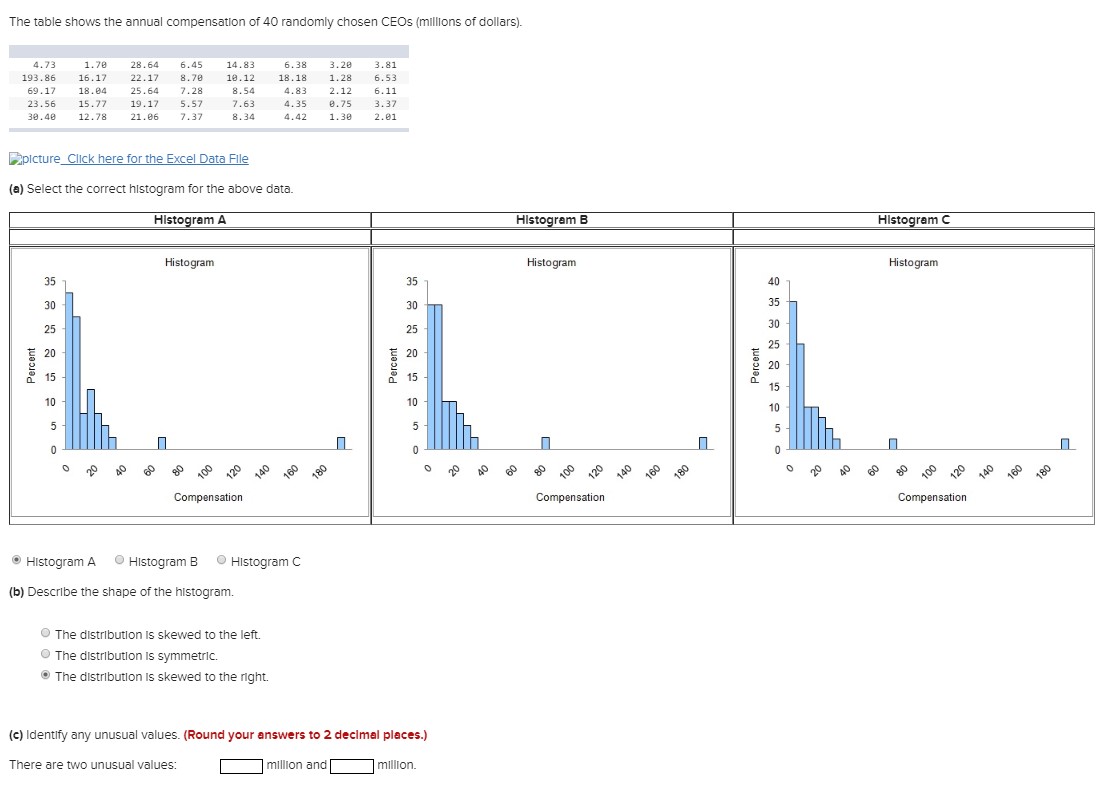
Please help with answer (c)...Thank you The table shows the annual compensation of 40 randomly chosen CEOs (millions of dollars). 4.73 1. 76 28.64 6.45

Please help with answer (c)...Thank you

image text in transcribed
The table shows the annual compensation of 40 randomly chosen CEOs (millions of dollars). 4.73 1. 76 28.64 6.45 14.83 6.38 3. 20 3.81 193 . 86 16.17 22. 17 8.70 19.12 18 . 18 1. 28 6.53 69 . 17 18.84 25.64 7.28 8.54 4.83 2.12 6.11 23.56 15.77 19.17 5.57 7.63 4.35 2.75 3.37 30.40 12.78 21.06 7.37 8.34 4.42 1.30 2.01 Lapicture_Click here for the Excel Data File (a) Select the correct histogram for the above data. Histogram A Histogram B Histogram C Histogram Histogram Histogram 35 35 40 30 30 25 25 Percent 20 Percent 20 15 Percent 10 Un ACO 180 180 80 Compensation Compensation Compensation Histogram A . Histogram B . Histogram C (b) Describe the shape of the histogram. The distribution is skewed to the left. The distribution is symmetric. The distribution is skewed to the right. (c) Identify any unusual values. (Round your answers to 2 decimal places.) There are two unusual values: million and million

Step by Step Solution

There are 3 Steps involved in it

Step: 1

blur-text-image

Get Instant Access to Expert-Tailored Solutions

See step-by-step solutions with expert insights and AI powered tools for academic success

Step: 2

blur-text-image

Step: 3

blur-text-image

Ace Your Homework with AI

Get the answers you need in no time with our AI-driven, step-by-step assistance

Get Started

Recommended Textbook for

Shape Optimization And Optimal Design

Authors: John Cagnol

1st Edition

0824705564, 978-0824705565

More Books

Students also viewed these Mathematics questions