

Answered step by step
Verified Expert Solution
Question
1 Approved Answer
Please help with answering this problem BTN 1-2 Key comparative figures (S thousands) for both Polaris and Arctic Cat follow. COMPARATIVE ANALYSIS A1 A2 A3

Please help with answering this problem
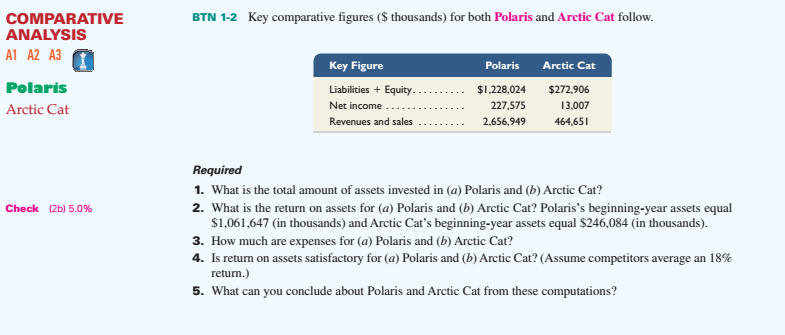
BTN 1-2 Key comparative figures (S thousands) for both Polaris and Arctic Cat follow. COMPARATIVE ANALYSIS A1 A2 A3 Key Figure Polaris Arctic Cat Polaris Arctic Cat Liabilities + Equity. Net income Revenues and sales $1.228,024 $272.906 227,57513,007 2,656,949 464,65 Required 1. What is the total amount of assets invested in (a) Polaris and (b) Arctic Cat? 2. What is the return on assets for (a) Polaris and (b) Arctic Cat? Polaris's beginning-year assets equal Check (2b) 5.0% $1,061,647 (in thousands) and Arctic Cat's beginning-year assets equal $246,084 (in thousands). 3. How much are expenses for (a) Polaris and (b) Arctic Cat? 4. Is return on assets satisfactory for (a) Polaris and (b) Arctic Cat? (Assume competitors average an 18% return.) 5. What can you conclude about Polaris and Arctic Cat from these computationsStep by Step Solution
There are 3 Steps involved in it
Step: 1

Get Instant Access to Expert-Tailored Solutions
See step-by-step solutions with expert insights and AI powered tools for academic success
Step: 2

Step: 3
Ace Your Homework with AI
Get the answers you need in no time with our AI-driven, step-by-step assistance
Get Started
Audit Studies Behind The Scenes With Theory Method And Nuance
Authors: S. Michael Gaddis
1st Edition
3030100200, 978-3030100209