Please help with below problem. I have attached it orderly.
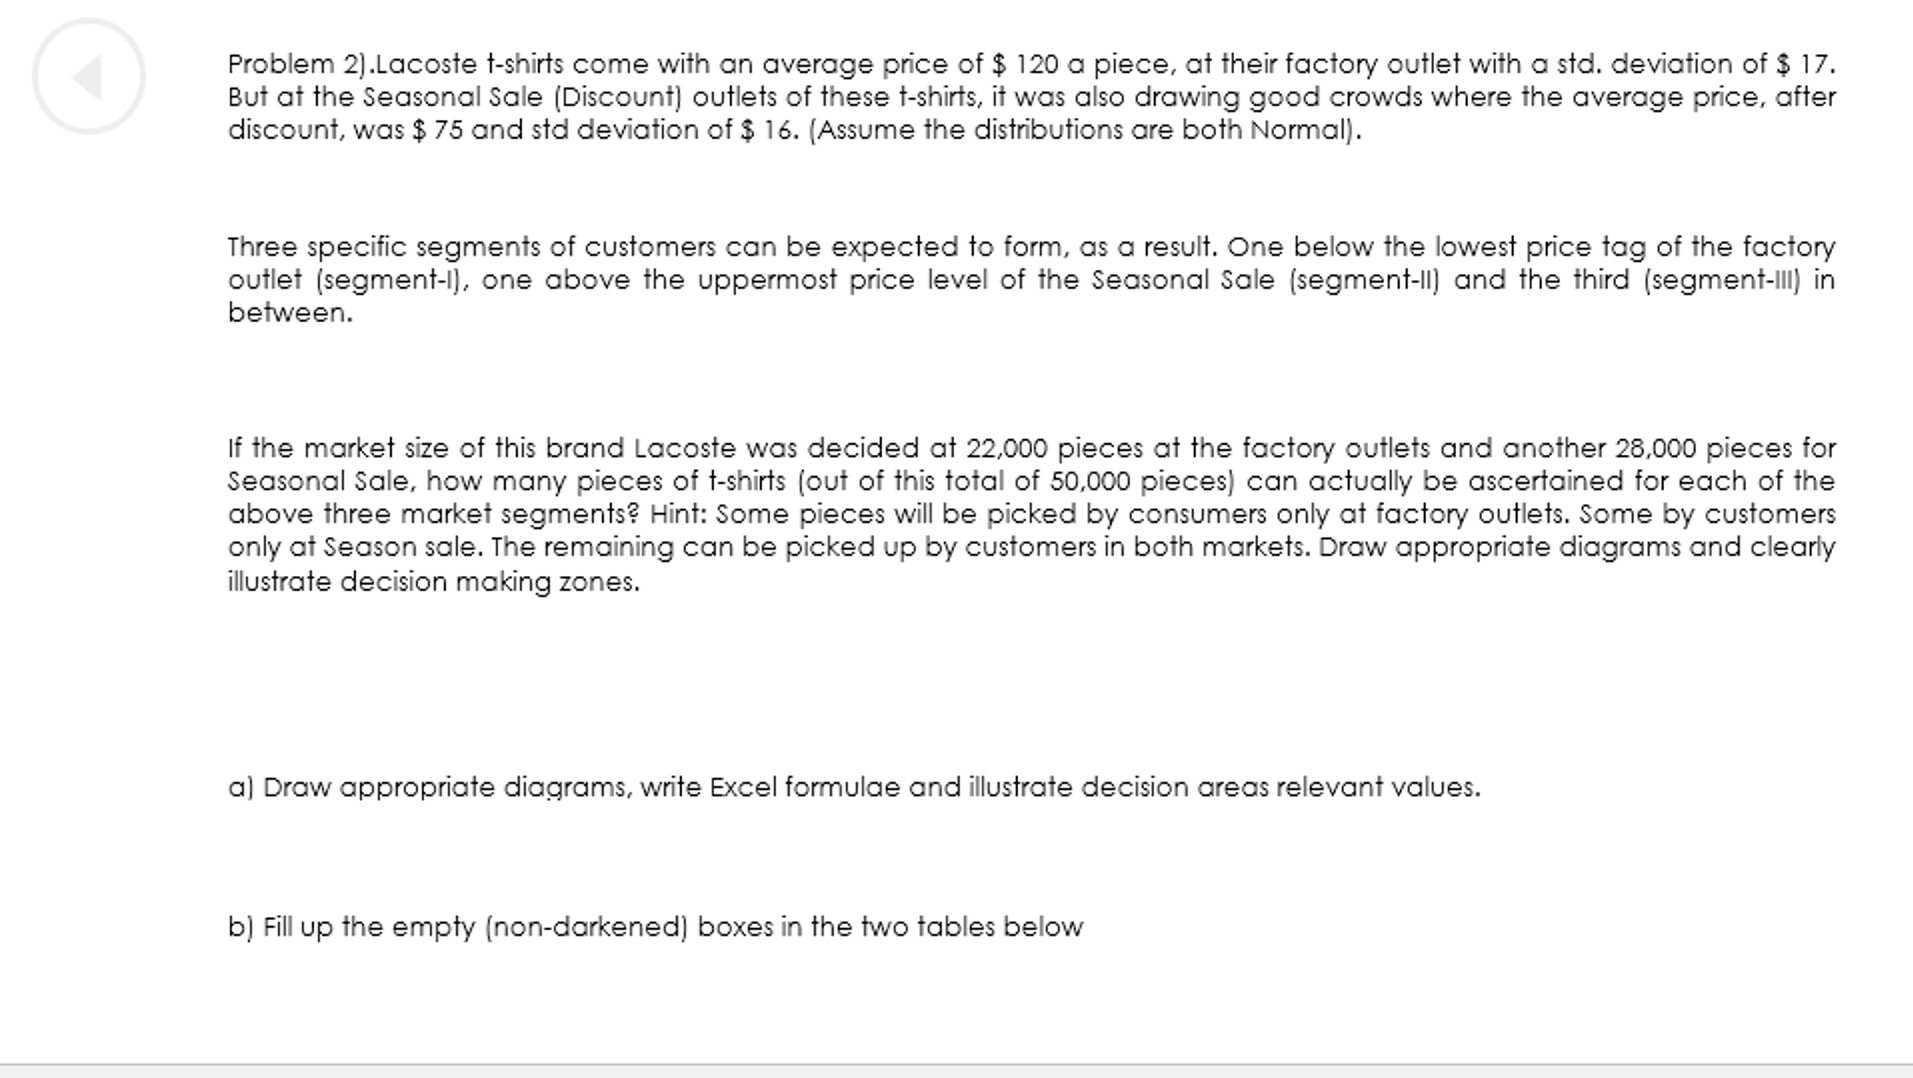
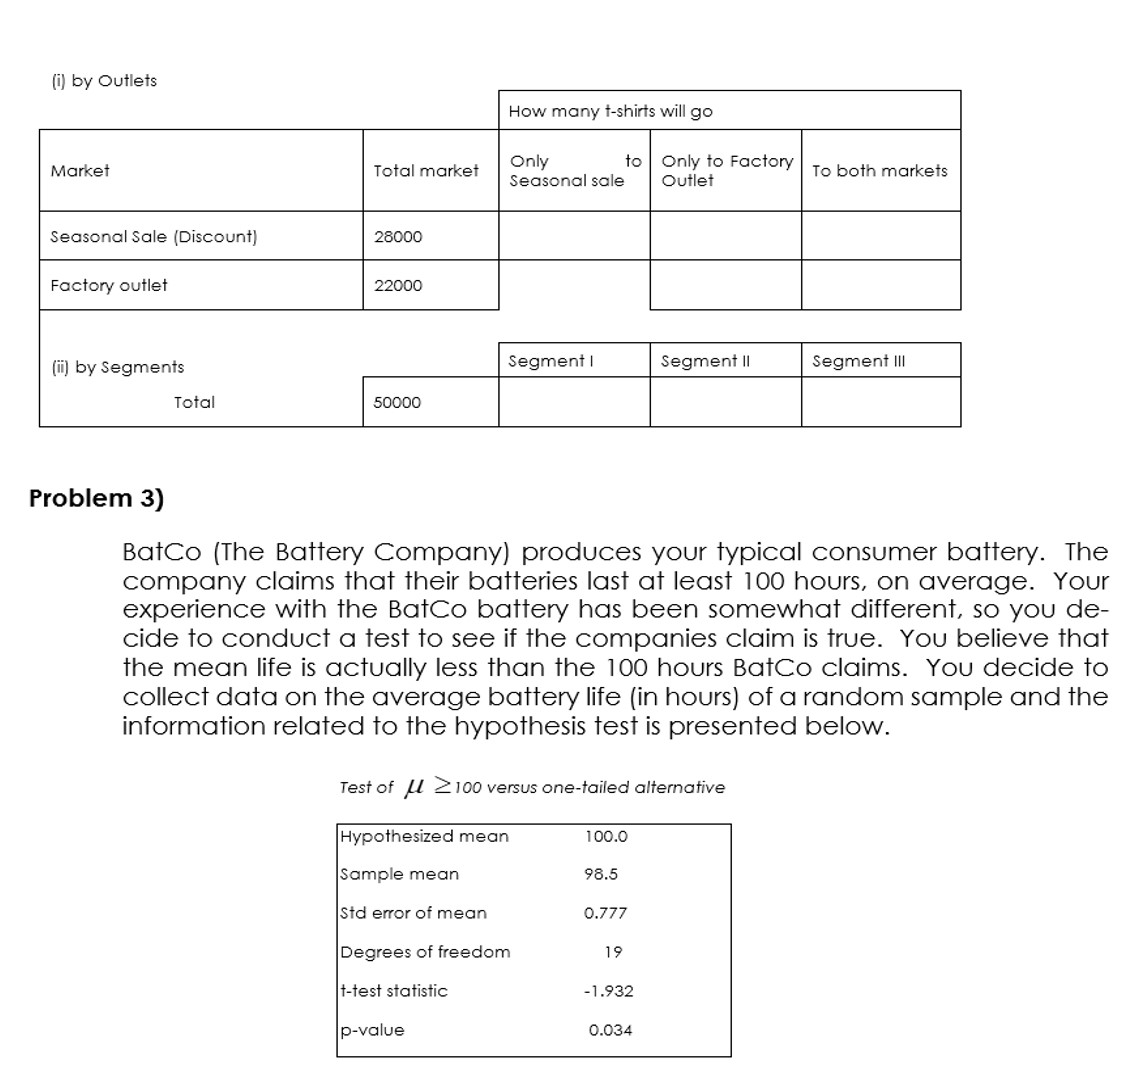
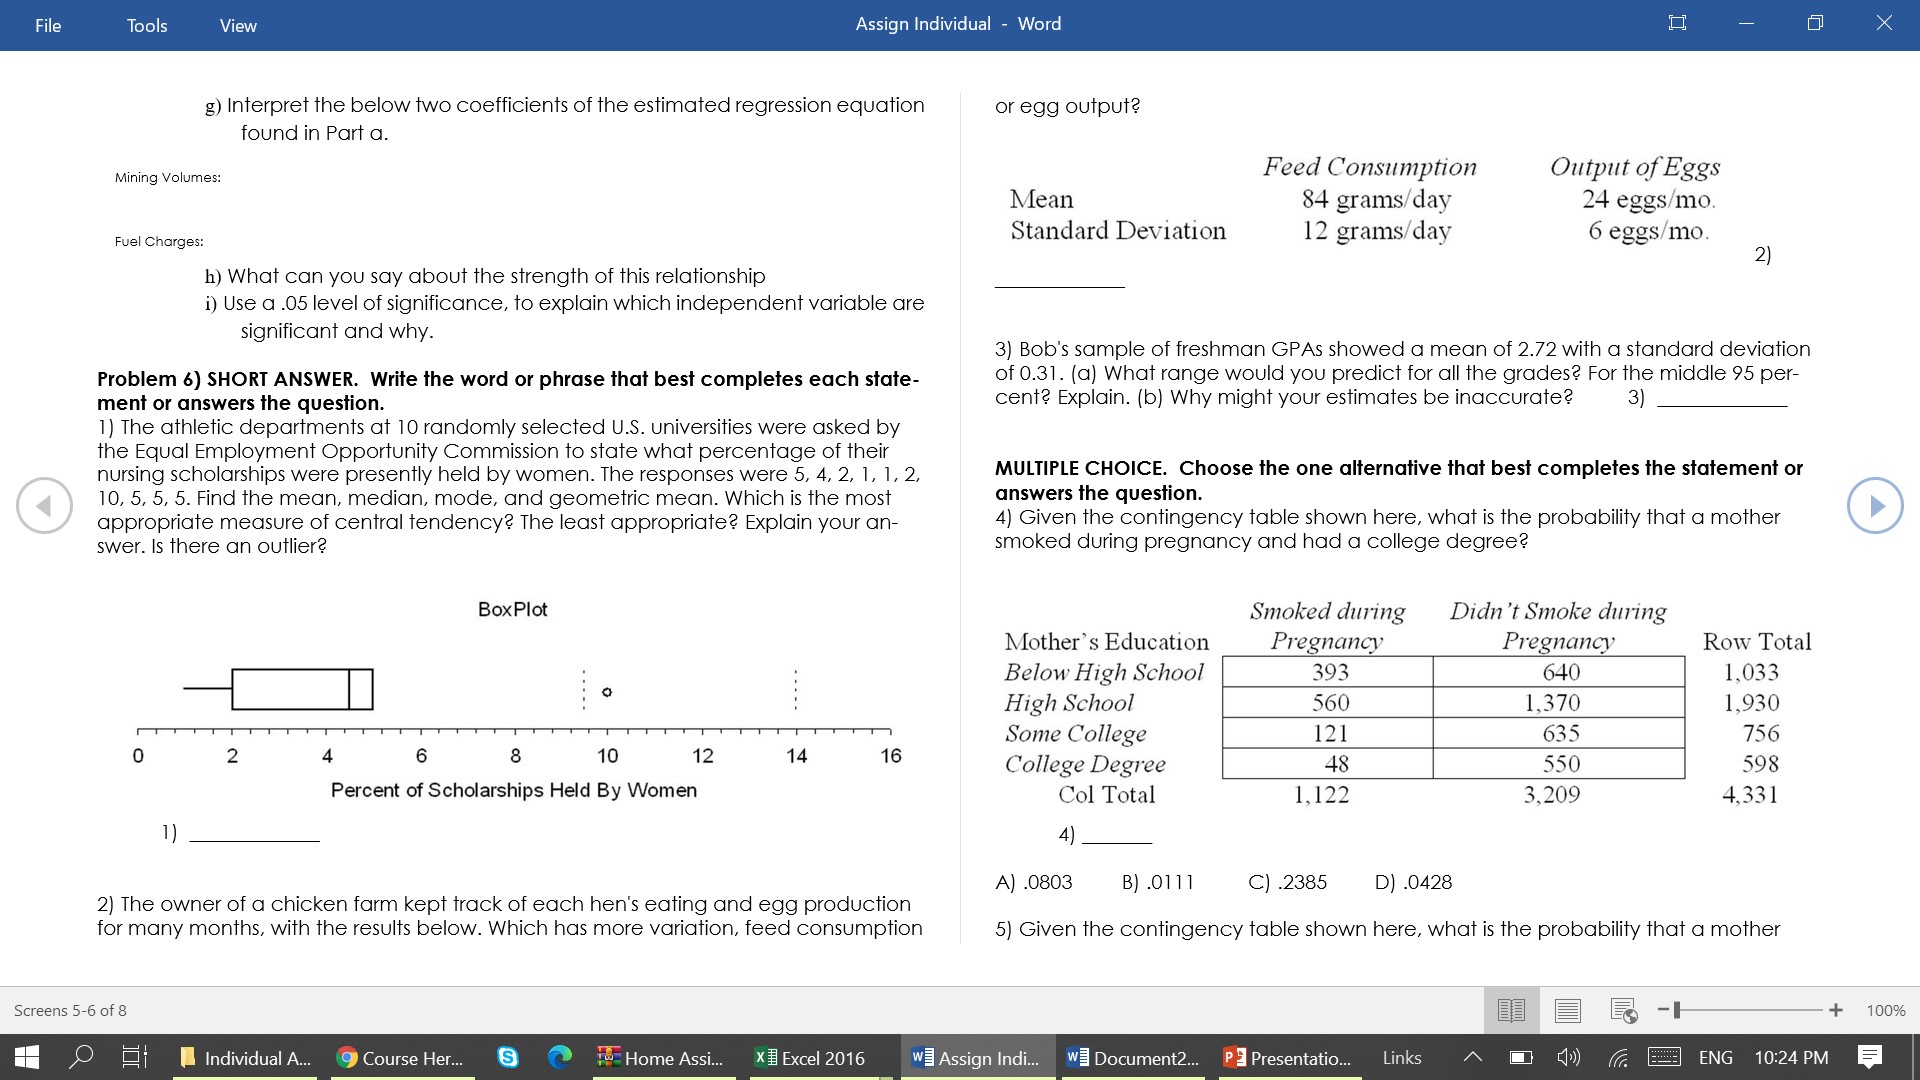
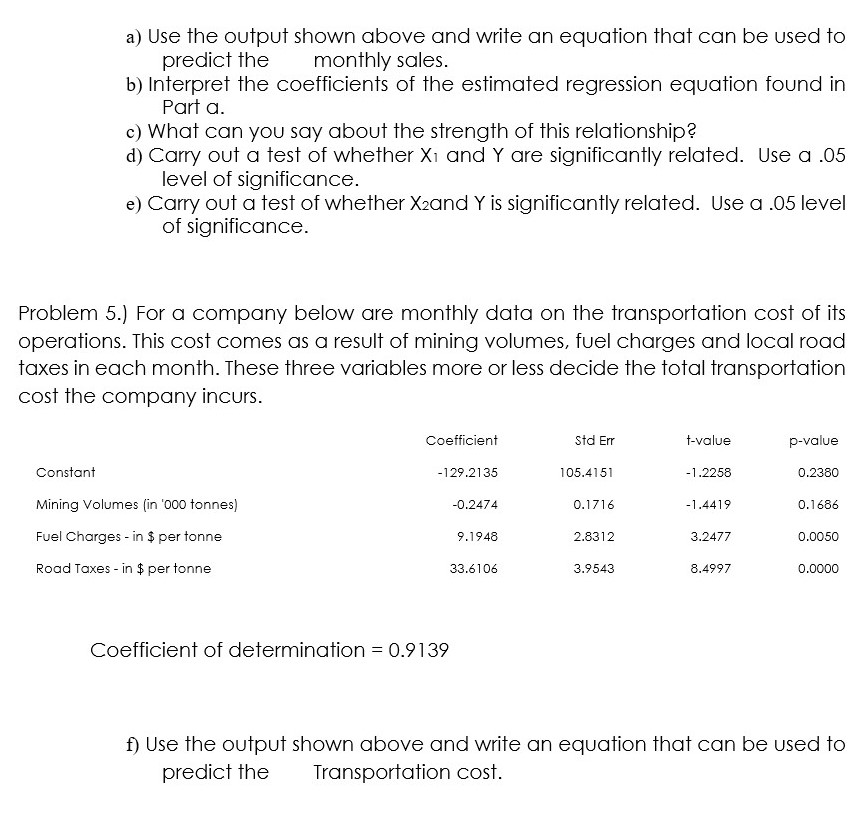
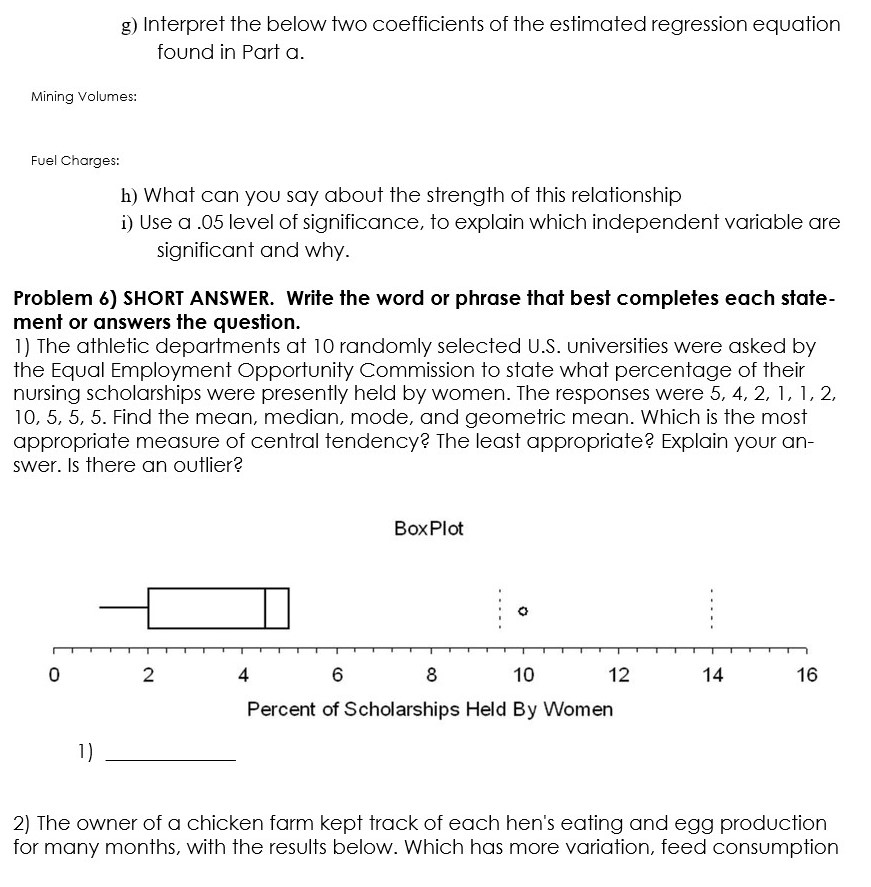
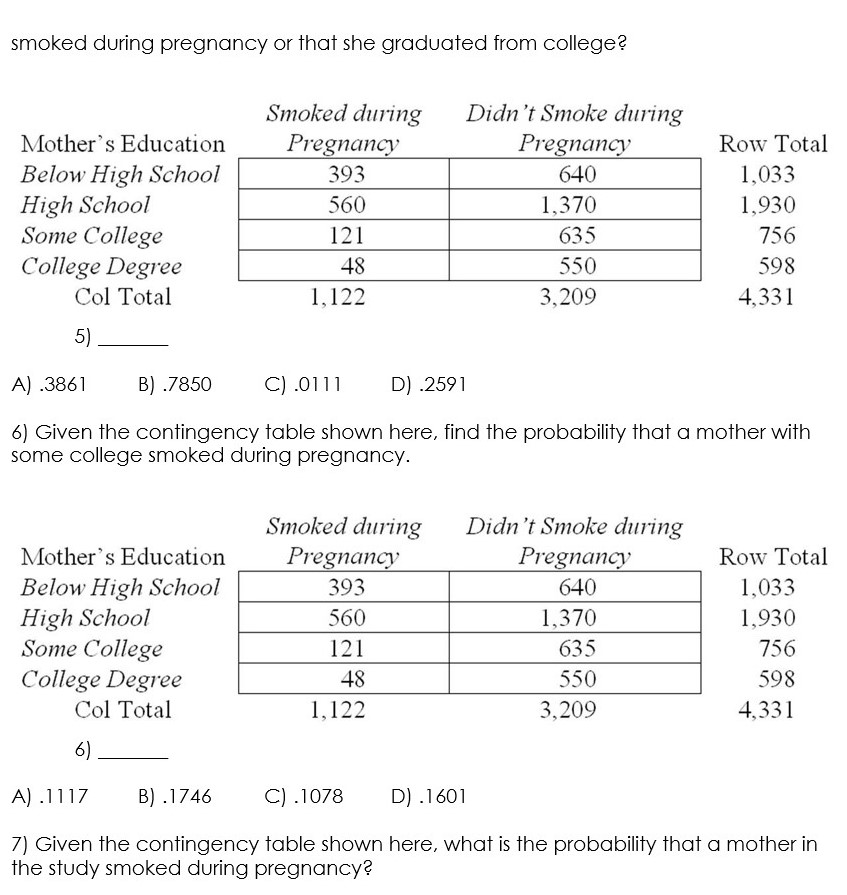
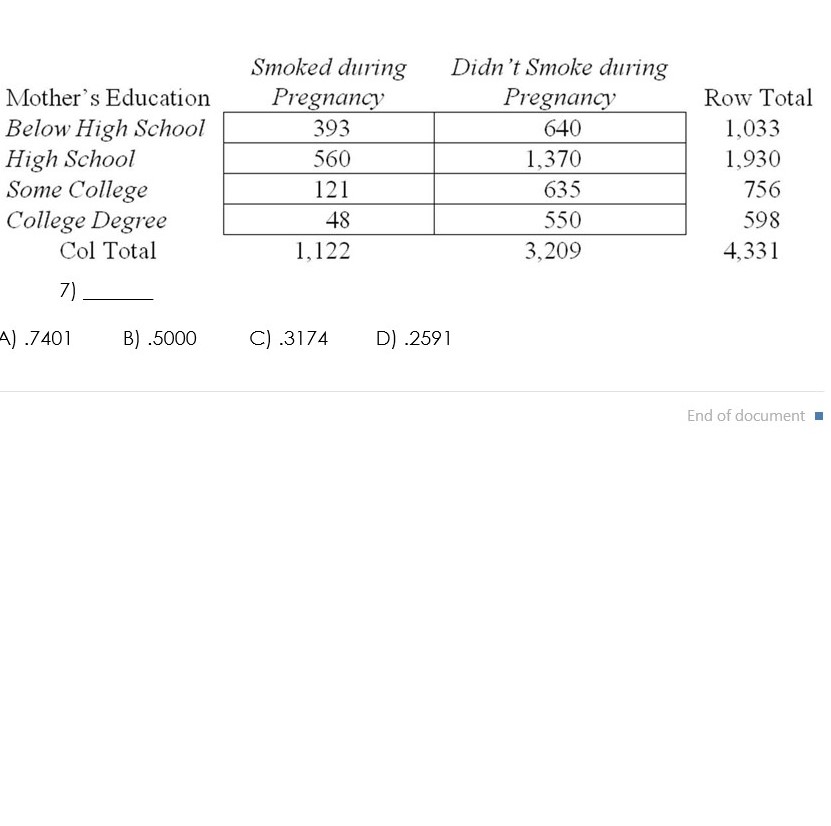
Problem 2}.Locoste t-shirts come with on average price of $ 120 a piece, at their factory outlet with a std. deviation of $ 17. But at the Seasonal Sale {Discount} outlets of these t-shirts. it was also drawing good crowds where the average price, after discount, was $ 75 and std deviation of 3 16. [Assume the distributions are both Normal). Three specic segments of customers can be expected to form. as a result. One below the lowest price tag of the factory outlet (segment-l), one above the uppermost price level of the Seasonal Sale [segment[l] and the third (segment-Ill) in between. If the market size of this brand Locoste was decided at 22,000 pieces at the factory outlets and another 28,000 pieces for Seasonal Sale. how many pieces of t-shirts (out of this total of 50,000 pieces) can actually be ascertained for each of the above three market segments? Hint: Some pieces will be picked by consumers only at factory outlets. Some by customers only at Season sale. The remaining can be picked up by customers in both markets. Draw appropriate diagrams and clearly illustrate decision making zones. 0) Draw appropriate diagrams. write Excel formulae and illustrate decision areas relevant values. b] Fill up the empty (non-darkened] boxes in the two tables below [it by Outlets How many tshirls will go Only to Only to Factory Seasonal sale Outlet To both markets Market Total market Seasonal Sale (Discom Factory outlet [ii] by Segments Total Problem 3) BatCo (The Battery Company) produces your typical consumer battery. The company claims that their batteries last at least 100 hours, on average. Your experience with the BatCo battery has been somewhat different, so you de- cide to conduct a test to see if the companies claim is true. You believe that the mean life is actually less than the 100 hours BotCo claims. You decide to collect data on the average battery life [in hours) of a random sample and the information related to the hypothesis test is presented below. Test of 2100 versus one-tailed alternative Hypothesized mean Sample mean Std error of mean Degrees of freedom f-test statistic p-value a. Can the sampie size be determined from the information above? Yes or no? If yes, what is the sarnpte size in this case? b. You believe that the mean life is actually less than 100 hours, should you conduct a onetailed or a twotailed hypothesis test? Explain your answer. c. What is the sample rnean of this data? if you use a 5% signicance level, would you conclude that the mean life of the batteries is typicatiy more than i00 hours? Ex plain your answer. d. If you were to use a 1% significance level in this case. would you conclude that the mean life of the batteries is typically more than 100 hours? Explain your answer. Problem 4 The following results were obtained from a multiple regression analysis of Mohideen supermarket profitability. The dependent variable. Y. is the profit [in Hundred of dollars] and the independent variables, X1 and X2, are the food sales and nonfood sales [in thousands of dollars). Coefficient Standard Error t value pvalue Constant 'I 5.062 XI 0.09?2 0.054 0.075 0.132 X2 0.2484 0.092 3.45.7 0.0075 Coefficient of determination = 0.7139 File Tools View Assign Individual - Word X g) Interpret the below two coefficients of the estimated regression equation or egg output? found in Part a. Mining Volumes: Feed Consumption Output of Eggs Mean 84 grams/day 24 eggs/mo. Fuel Charges: Standard Deviation 12 grams/day 6 eggs/mo. 2 ) h) What can you say about the strength of this relationship i) Use a .05 level of significance, to explain which independent variable are significant and why. 3) Bob's sample of freshman GPAs showed a mean of 2.72 with a standard deviation Problem 6) SHORT ANSWER. Write the word or phrase that best completes each state- of 0.31. (a) What range would you predict for all the grades? For the middle 95 per- ment or answers the question. cent? Explain. (b) Why might your estimates be inaccurate? 3) 1) The athletic departments at 10 randomly selected U.S. universities were asked by the Equal Employment Opportunity Commission to state what percentage of their nursing scholarships were presently held by women. The responses were 5, 4, 2, 1, 1, 2, MULTIPLE CHOICE. Choose the one alternative that best completes the statement or 10, 5, 5, 5. Find the mean, median, mode, and geometric mean. Which is the most answers the question. appropriate measure of central tendency? The least appropriate? Explain your an- 4) Given the contingency table shown here, what is the probability that a mother swer. Is there an outlier? smoked during pregnancy and had a college degree? BoxPlot Smoked during Didn't Smoke during Mother's Education Pregnancy Pregnancy Row Total . . . . . . . . . Below High School 393 640 1,033 High School 560 1,370 1,930 Some College 121 635 756 2 8 10 12 14 16 College Degree 48 550 598 Percent of Scholarships Held By Women Col Total 1,122 3,209 4,331 1) 4) A) .0803 B) .0111 C) .2385 D) .0428 2) The owner of a chicken farm kept track of each hen's eating and egg production for many months, with the results below. Which has more variation, feed consumption 5) Given the contingency table shown here, what is the probability that a mother Screens 5-6 of 8 + 100% O Individual A.. 9 Course Her. S Home Assi. xExcel 2016 w Assign Indi. w Document2... P Presentation.. Links O () ENG 10:24 PMa) Use the output shown above and write an equation that can be used to predict the monthly sales. b) Interpret the coefficients of the estimated regression equation found in Part a. c) What can you say about the strength of this relationship? d) Carry out a test of whether Xi and Y are significantly related. Use a .05 level of significance. e) Carry out a test of whether Xzand Y is significantly related. Use a .05 level of significance. Problem 5.) For a company below are monthly data on the transportation cost of its operations. This cost comes as a result of mining volumes, fuel charges and local road taxes in each month. These three variables more or less decide the total transportation cost the company incurs. Coefficient Std Err t-value p-value Constant -129.2135 105.4151 -1.2258 0.2380 Mining Volumes (in '000 tonnes) -0.2474 0.1716 1.4419 D.1686 Fuel Charges - in $ per tonne 9.1948 2.8312 3.2477 0.0050 Road Taxes - in $ per tonne 33.6106 3.9543 8.4997 0.0000 Coefficient of determination = 0.9139 f) Use the output shown above and write an equation that can be used to predict the Transportation cost.g) Interpret the below two coefficients of the estimated regression equation found in Part a. Mining Volumes: Fuel Charges: h) What can you say about the strength of this relationship i) Use a .05 level of significance, to explain which independent variable are significant and why. Problem 6) SHORT ANSWER. Write the word or phrase that best completes each state- ment or answers the question. 1) The athletic departments at 10 randomly selected U.S. universities were asked by the Equal Employment Opportunity Commission to state what percentage of their nursing scholarships were presently held by women. The responses were 5, 4, 2, 1, 1, 2, 10, 5, 5, 5. Find the mean, median, mode, and geometric mean. Which is the most appropriate measure of central tendency? The least appropriate? Explain your an- swer. Is there an outlier? BoxPlot 2 4 6 8 10 12 14 16 Percent of Scholarships Held By Women 1) 2) The owner of a chicken farm kept track of each hen's eating and egg production for many months, with the results below. Which has more variation, feed consumptionsmoked during pregnancy or that she graduated from college? Smoked during Didn't Smoke during Mother's Education Pregnancy Pregnancy Row Total Below High School 393 640 1,033 High School 560 1,370 1,930 Some College 121 635 756 College Degree 48 550 598 Col Total 1,122 3,209 4,331 5) A) .3861 B) .7850 C) .0111 D) .2591 6) Given the contingency table shown here, find the probability that a mother with some college smoked during pregnancy. Smoked during Didn't Smoke during Mother's Education Pregnancy Pregnancy Row Total Below High School 393 640 1,033 High School 560 1,370 1,930 Some College 121 635 756 College Degree 48 550 598 Col Total 1,122 3,209 4,331 6) A) .1117 B) . 1746 C) . 1078 DJ . 1601 7) Given the contingency table shown here, what is the probability that a mother in the study smoked during pregnancy?Smoked during Didn't Smoke during Mother's Education Pregnancy Pregnancy Row Total Below High School 393 640 1,033 High School 560 1,370 1,930 Some College 121 635 756 College Degree 48 550 598 Col Total 1, 122 3,209 4,331 7) A) .7401 B) .5000 C) .3174 D) .2591 End of document