

Question
Please help with me computational modeling and using python! I don't believe my current answer is correct, I don't know what a stem command is.
Please help with me computational modeling and using python! I don't believe my current answer is correct, I don't know what a stem command is. Any help is greatly appreciated, thank you!
Provided variables for copy:
# Provided variables num_samples = 500 num_subintervals = 10 signal = np.array([ 1, 1, 1, 1, 1, 1, 1, 1, 1, 1, 1, 1, 1, 1, 1, 1, 1, 1, 1, 1, 1, 1, 1, 1, 1, 1, 1, 1, 1, 1, 1, 1, 1, 1, 1, 1, 1, 1, 1, 1, 1, 1, 1, 1, 1, 1, 1, 1, 1, 1, 6, 6, 6, 6, 6, 6, 6, 6, 6, 6, 6, 6, 6, 6, 6, 6, 6, 6, 6, 6, 6, 6, 6, 6, 6, 6, 6, 6, 6, 6, 6, 6, 6, 6, 6, 6, 6, 6, 6, 6, 6, 6, 6, 6, 6, 6, 6, 6, 6, 6, 6, 6, 6, 6, 6, 6, 6, 6, 6, 6, 6, 6, 6, 6, 6, 6, 6, 6, 6, 6, 6, 6, 6, 6, 6, 6, 6, 6, 6, 6, 6, 6, 6, 6, 6, 6, 6, 6, 6, 6, 6, 6, 6, 6, 6, 6, 6, 6, 6, 6, 1, 1, 1, 1, 1, 1, 1, 1, 1, 1, 1, 1, 1, 1, 1, 1, 1, 1, 1, 1, 1, 1, 1, 1, 1, 1, 1, 1, 1, 1, 1, 1, 1, 1, 1, 1, 1, 1, 1, 1, 1, 1, 1, 1, 1, 1, 1, 1, 1, 1, 10, 10, 10, 10, 10, 10, 10, 10, 10, 10, 10, 10, 10, 10, 10, 10, 10, 10, 10, 10, 10, 10, 10, 10, 10, 10, 10, 10, 10, 10, 10, 10, 10, 10, 10, 10, 10, 10, 10, 10, 10, 10, 10, 10, 10, 10, 10, 10, 10, 10, 3, 3, 3, 3, 3, 3, 3, 3, 3, 3, 3, 3, 3, 3, 3, 3, 3, 3, 3, 3, 3, 3, 3, 3, 3, 3, 3, 3, 3, 3, 3, 3, 3, 3, 3, 3, 3, 3, 3, 3, 3, 3, 3, 3, 3, 3, 3, 3, 3, 3, 3, 3, 3, 3, 3, 3, 3, 3, 3, 3, 3, 3, 3, 3, 3, 3, 3, 3, 3, 3, 3, 3, 3, 3, 3, 3, 3, 3, 3, 3, 3, 3, 3, 3, 3, 3, 3, 3, 3, 3, 3, 3, 3, 3, 3, 3, 3, 3, 3, 3, 5, 5, 5, 5, 5, 5, 5, 5, 5, 5, 5, 5, 5, 5, 5, 5, 5, 5, 5, 5, 5, 5, 5, 5, 5, 5, 5, 5, 5, 5, 5, 5, 5, 5, 5, 5, 5, 5, 5, 5, 5, 5, 5, 5, 5, 5, 5, 5, 5, 5, 4, 4, 4, 4, 4, 4, 4, 4, 4, 4, 4, 4, 4, 4, 4, 4, 4, 4, 4, 4, 4, 4, 4, 4, 4, 4, 4, 4, 4, 4, 4, 4, 4, 4, 4, 4, 4, 4, 4, 4, 4, 4, 4, 4, 4, 4, 4, 4, 4, 4, 9, 9, 9, 9, 9, 9, 9, 9, 9, 9, 9, 9, 9, 9, 9, 9, 9, 9, 9, 9, 9, 9, 9, 9, 9, 9, 9, 9, 9, 9, 9, 9, 9, 9, 9, 9, 9, 9, 9, 9, 9, 9, 9, 9, 9, 9, 9, 9, 9, 9]) sampling_locations=np.arange(0,10,10um_samples) #create an array with the sample locations in [0,1]
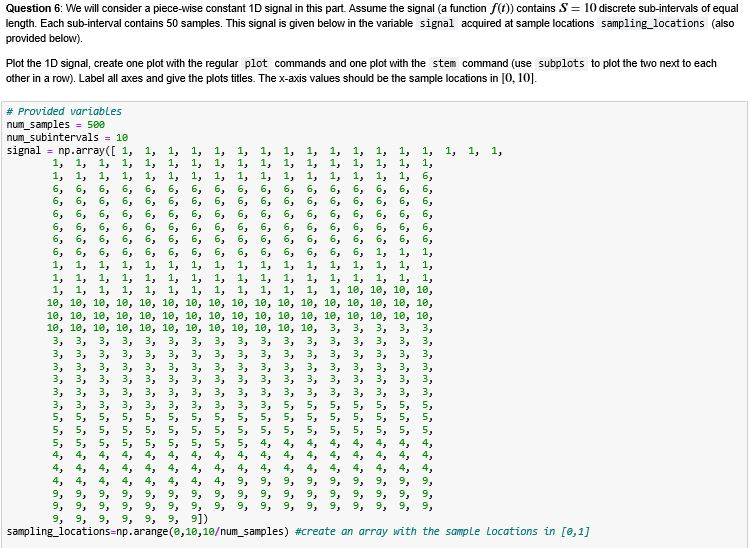
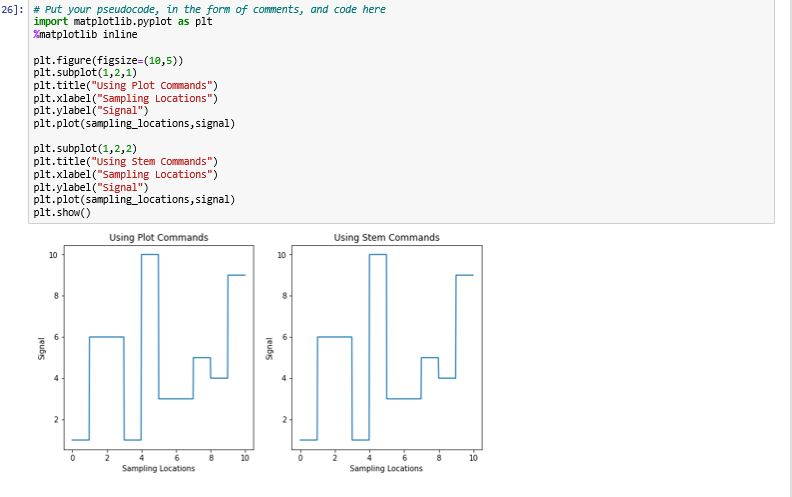
1, 1, 1, 1, 1, 1, 2, Question 6: We will consider a piece-wise constant 10 signal in this part. Assume the signal (a function fb)) contains S = 10 discrete sub-intervals of equal length. Each sub-interval contains 50 samples. This signal is given below in the variable signal acquired at sample locations sampling_locations (also provided below). Plot the 1D signal, create one plot with the regular plot commands and one plot with the stem command (use subplots to plot the two next to each other in a row). Label all axes and give the plots titles. The X-axis values should be the sample locations in (0, 10). - " " " " H H'' ''' ' ' ' ' ' '' ' ' " - - ' ' ' ' - ' ' - - - - - ' ' ' - = = =' - - - ' - - - - ' - - - =' ' ' - H ' ' ' ' ' '' - ' ' ' - - - f' f" f' ' '- '- ' 9, 9, 9, 4, 4, 9, 9, 9, 4, 4, 9, 9, 9, 4, 4, 9, 9, 8, 4, 4, 8, 9, 3, - 4, 3, 3, 9, sampling_locations=np.arange(0,10,10um_samples) #create an array with the sample Locations in [0,1] 4, 2, 9, 9, 4, 9, 9, 8, 4, 8, 9, 5, 4, 4, 9, 3, 4, 4, 9, 9, 9]) 4, 4, 9, 8, 9, 4, 4, 9, 5, 9, 4, 4, 9, 3, 9, 4, 4, 9, 9, 9, 4, 4, 9, 9, 9, 4, 4, 9, 9, 9, 1, 1, 1, 1, 1, 1, 1, 1, 1, 1, 1, # Provided variables num_samples = 500 num_subintervals = 10 signal = np . array([ 1, 1, 1, 0 0 0 - - - 26]: # Put your pseudocode, in the form of comments, and code here import matplotlib.pyplot as plt matplotlib inline plt. figure(figsize-(10,5)) plt. subplot(1,2,1) plt.title(using Plot commands") plt.xlabel("Sampling Locations") plt.ylabel("Signal") plt.plot(sampling_locations,signal) plt. subplot(1,2,2) pit.title("Using Stem Commands") plt.xlabel("Sampling Locations") pit.ylabel("Signal") plt.plot(sampling_locations,signal) plt.show() Using Plot Commands Using Stem Commands Signal JUS Sampling Locations Sampling Locations
Step by Step Solution
There are 3 Steps involved in it
Step: 1

Get Instant Access to Expert-Tailored Solutions
See step-by-step solutions with expert insights and AI powered tools for academic success
Step: 2

Step: 3
Ace Your Homework with AI
Get the answers you need in no time with our AI-driven, step-by-step assistance
Get Started
Spatial Databases With Application To GIS
Authors: Philippe Rigaux, Michel Scholl, Agnès Voisard
1st Edition
1558605886, 978-1558605886