

Answered step by step
Verified Expert Solution
Question
1 Approved Answer
Please help with part A, B and C. I have provided the data needed for this problem and I would very much appreciate shown work
Please help with part A, B and C. I have provided the data needed for this problem and I would very much appreciate shown work as well. Thank you!
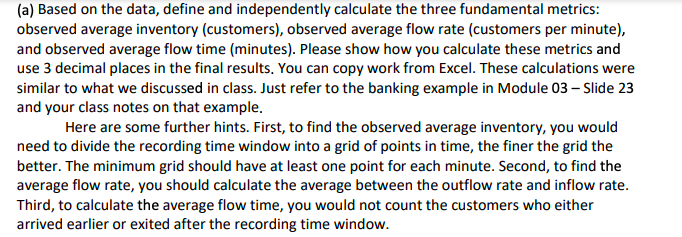
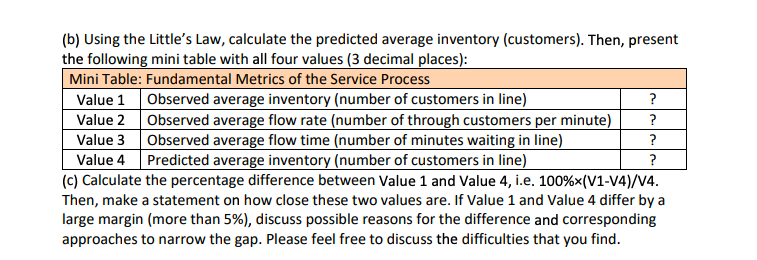
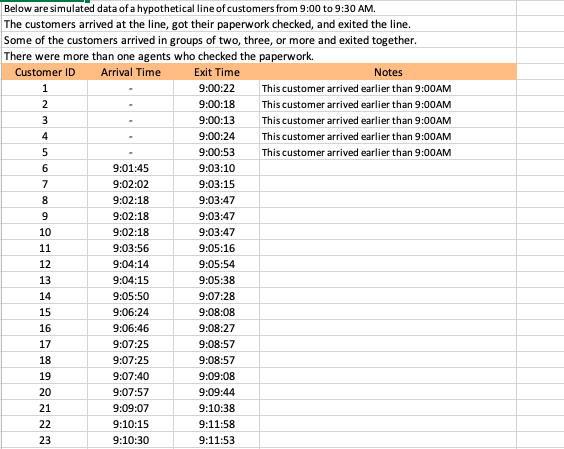
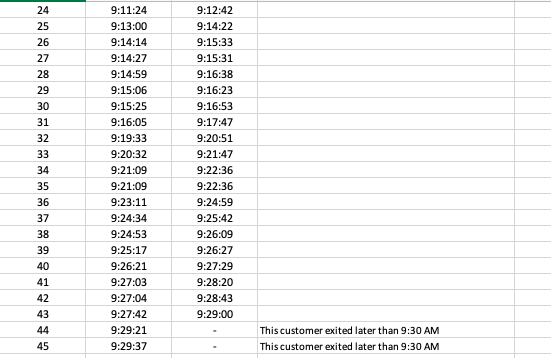
(a) Based on the data, define and independently calculate the three fundamental metrics: observed average inventory (customers), observed average flow rate (customers per minute), and observed average flow time (minutes). Please show how you calculate these metrics and use 3 decimal places in the final results. You can copy work from Excel. These calculations were similar to what we discussed in class. Just refer to the banking example in Module 03 - Slide 23 and your class notes on that example. Here are some further hints. First, to find the observed average inventory, you would need to divide the recording time window into a grid of points in time, the finer the grid the better. The minimum grid should have at least one point for each minute. Second, to find the average flow rate, you should calculate the average between the outflow rate and inflow rate. Third, to calculate the average flow time, you would not count the customers who either arrived earlier or exited after the recording time window. (b) Using the Little's Law, calculate the predicted average inventory (customers). Then, present the following mini table with all four values ( 3 decimal places): (c) Calculate the percentage difference between Value 1 and Value 4, i.e. 100\%(V1-V4)/V4. Then, make a statement on how close these two values are. If Value 1 and Value 4 differ by a large margin (more than 5% ), discuss possible reasons for the difference and corresponding approaches to narrow the gap. Please feel free to discuss the difficulties that you find. Below are simulated data of a hypothetical line of customers from 9:00 to 9:30 AM. \begin{tabular}{|l|l|l|l|} \hline 24 & 9:11:24 & 9:12:42 & \\ \hline 25 & 9:13:00 & 9:14:22 & \\ \hline 26 & 9:14:14 & 9:15:33 & \\ \hline 27 & 9:14:27 & 9:15:31 & \\ \hline 28 & 9:14:59 & 9:16:38 & \\ \hline 29 & 9:15:06 & 9:16:23 & \\ \hline 30 & 9:15:25 & 9:16:53 & \\ \hline 31 & 9:16:05 & 9:17:47 & \\ \hline 32 & 9:19:33 & 9:20:51 & \\ \hline 33 & 9:20:32 & 9:21:47 & \\ \hline 34 & 9:21:09 & 9:22:36 & \\ \hline 35 & 9:21:09 & 9:22:36 & \\ \hline 36 & 9:23:11 & 9:24:59 & \\ \hline 37 & 9:24:34 & 9:25:42 & \\ \hline 38 & 9:24:53 & 9:26:09 & \\ \hline 39 & 9:25:17 & 9:26:27 & \\ \hline 40 & 9:26:21 & 9:27:29 & \\ \hline 41 & 9:27:03 & 9:28:20 & \\ \hline 42 & 9:27:04 & 9:28:43 & \\ \hline 43 & 9:27:42 & 9:29:00 & \\ \hline 44 & 9:29:21 & & This customer exited later than 9:30 AM \\ \hline 45 & 9:29:37 & & This customer exited later than 9:30 AM \\ \hline \end{tabular} (a) Based on the data, define and independently calculate the three fundamental metrics: observed average inventory (customers), observed average flow rate (customers per minute), and observed average flow time (minutes). Please show how you calculate these metrics and use 3 decimal places in the final results. You can copy work from Excel. These calculations were similar to what we discussed in class. Just refer to the banking example in Module 03 - Slide 23 and your class notes on that example. Here are some further hints. First, to find the observed average inventory, you would need to divide the recording time window into a grid of points in time, the finer the grid the better. The minimum grid should have at least one point for each minute. Second, to find the average flow rate, you should calculate the average between the outflow rate and inflow rate. Third, to calculate the average flow time, you would not count the customers who either arrived earlier or exited after the recording time window. (b) Using the Little's Law, calculate the predicted average inventory (customers). Then, present the following mini table with all four values ( 3 decimal places): (c) Calculate the percentage difference between Value 1 and Value 4, i.e. 100\%(V1-V4)/V4. Then, make a statement on how close these two values are. If Value 1 and Value 4 differ by a large margin (more than 5% ), discuss possible reasons for the difference and corresponding approaches to narrow the gap. Please feel free to discuss the difficulties that you find. Below are simulated data of a hypothetical line of customers from 9:00 to 9:30 AM. \begin{tabular}{|l|l|l|l|} \hline 24 & 9:11:24 & 9:12:42 & \\ \hline 25 & 9:13:00 & 9:14:22 & \\ \hline 26 & 9:14:14 & 9:15:33 & \\ \hline 27 & 9:14:27 & 9:15:31 & \\ \hline 28 & 9:14:59 & 9:16:38 & \\ \hline 29 & 9:15:06 & 9:16:23 & \\ \hline 30 & 9:15:25 & 9:16:53 & \\ \hline 31 & 9:16:05 & 9:17:47 & \\ \hline 32 & 9:19:33 & 9:20:51 & \\ \hline 33 & 9:20:32 & 9:21:47 & \\ \hline 34 & 9:21:09 & 9:22:36 & \\ \hline 35 & 9:21:09 & 9:22:36 & \\ \hline 36 & 9:23:11 & 9:24:59 & \\ \hline 37 & 9:24:34 & 9:25:42 & \\ \hline 38 & 9:24:53 & 9:26:09 & \\ \hline 39 & 9:25:17 & 9:26:27 & \\ \hline 40 & 9:26:21 & 9:27:29 & \\ \hline 41 & 9:27:03 & 9:28:20 & \\ \hline 42 & 9:27:04 & 9:28:43 & \\ \hline 43 & 9:27:42 & 9:29:00 & \\ \hline 44 & 9:29:21 & & This customer exited later than 9:30 AM \\ \hline 45 & 9:29:37 & & This customer exited later than 9:30 AM \\ \hline \end{tabular}Step by Step Solution
There are 3 Steps involved in it
Step: 1

Get Instant Access to Expert-Tailored Solutions
See step-by-step solutions with expert insights and AI powered tools for academic success
Step: 2

Step: 3
Ace Your Homework with AI
Get the answers you need in no time with our AI-driven, step-by-step assistance
Get Started
Essentials Of Real Estate Finance
Authors: David Sirota, Doris Barrell
14th Edition
1475428391, 9781475428391