please help with pro forma income statement and balance sheet for the next year. and excel chart of sales by year for all years including pro forma estimate
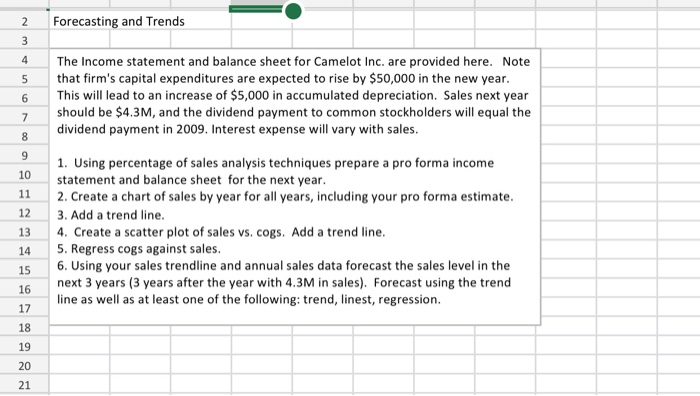
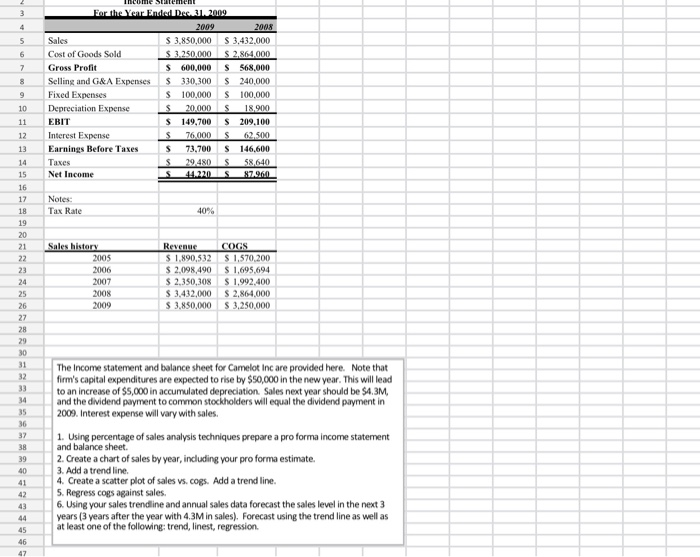
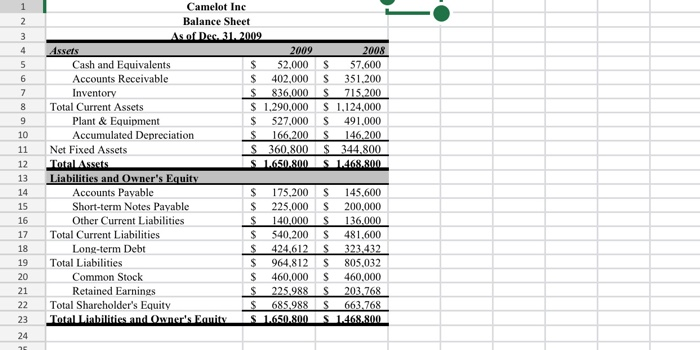
Forecasting and Trends 2. 3 4 The Income statement and balance sheet for Camelot Inc. are provided here. Note that firm's capital expenditures are expected to rise by $50,000 in the new year. This will lead to an increase of $5,000 in accumulated depreciation. Sales next year should be $4.3M, and the dividend payment to common stockholders will equal the dividend payment in 2009. Interest expense will vary with sales. 6 7 8 9 1. Using percentage of sales analysis techniques prepare a pro forma income statement and balance sheet for the next year 2. Create a chart of sales by year for all years, including your pro forma estimate 10 11 12 3. Add a trend line. 4. Create a scatter plot of sales vs. cogs. Add a trend line. 13 5. Regress cogs against sales. 14 6. Using your sales trendline and annual sales data forecast the sales level in the next 3 years (3 years after the year with 4.3M in sales). Forecast using the trend line as well as at least one of the following: trend, linest, regression 15 16 17 18 19 20 21 ome For the Year Ended Dec. 31, 2009 3 2009 2008 S 3.850,000 S 3.250,000 S 600,000 $ 3,432,000 Sales 5 Cost of Goods Sold S2,864,000 S 568,000 S 240,000 Gross Profit 8 Selling and G&A Expenses 330,300 S 100,000 100,000 9 Fixed Expenses 10 Depreciation Expense S 20.000 18,900 S 209.100 T 149,700 11 Interest Expense S 76,000 S 62,500 12 S 146,600 Earnings Before Taxes 73,700 13 es 29.480 S 58,640 14 Net Income S. 44.220 S 87.960 15 16 Notes 17 Rate 40% 18 19 20 Sales history Revenue S1,890,532 $ 2,098,490 $ 2.350,308 $ 3,432,000 GS 21 $ 1,570,200 S1,695,694 22 2005 2006 23 2007 $1,992,400 S2,864,000 $ 3,250,000 24 2008 25 2009 S3,850,000 26 27 28 29 30 31 The Income statement and balance sheet for Camelot Inc are provided here. Note that firm's capital expenditures are expected to rise by $50,000 in the new year. This will lead to an increase of $5,000 in accumulated depreciation. Sales next year should be $4.3M, and the dividend payment to common stockholders will equal the dividend payment in 2009. Interest expense will vary with sales 32 33 34 35 36 1. Using percentage of sales analysis techniques prepare a pro forma income statement and balance sheet 2. Create a chart of sales by year, including your pro forma estimate 37 38 39 40 3. Add a trend line. 4. Create a scatter plot of sales vs. cogs. Add a trend line. 5. Regress cogs against sales. 6. Using your sales trendline and annual sales data forecast the sales level in the next 3 years (3 years after the year with 4.3M in sales). Forecast using the trend line as well as at least one of the following: trend, linest, regression 41 42 43 44 45 46 47 1 Camelot Inc Balance Sheet 2 As of Dec. 31, 2009 3 2009 Assets 2008 Cash and Equivalents Accounts Receivable 52,000 57,600 S 351,200 6 402,000 7 Inventory 836,000 715.200 S 1,124,000 S1,290,000 8 Total Current Assets $ 9 Plant & Equipment Accumulated Depreciation 527,000 491,000 166,200 146,200 $ 344,800 S 1.468.800 10 S Net Fixed Assets S 360,800 11 Total Assets Liabilities and Owner's Equity S 1.650.800 12 13 Accounts Payable 175,200 S 145,600 14 Short-term Notes Payable S 225,000 200,000 15 Other Current Liabilities 140,000 S 136,000 16 Total Current Liabilities 540,200 17 481,600 Long-term Debt S 323,432 18 424,612 964,812 19 Total Liabilities 805,032 S 20 Common Stock 460,000 S 460,000 225.988 685,988 S 1.650.800 203.768 663,768 21 Retained Earnings Total Shareholder's Equity Total Liabilities and Owner's Equity 22 S 1.468,800 23 24 Camelot Inc 1 Statement of Cash Flows 2 For the Year Ended Dec. 31, 2009 (S in 000's). 3 Cash Flows from Operations 4 Net Income 44,220 5 Depreciation Expense Change in Accounts Receivable $ 20,000 6 $ (50,800) 7 $ (120,800) Change in Inventories 8 Change in Accounts Payable 29,600 Change in Other Current Liabilities 4,000 10 Total Cash Flows from Operations Cash Flows from Investing $ (73,780) 11 12 $ (36,000) Change in Plant & Equipment Total Cash Flows from Investing Cash Flows from Financing 13 $ (36.000) 14 15 25,000 Change in Short-term Notes Payable 16 S Change in Long-term Debt 101,180 17 Change in Common Stock 18 Cash Dividends Paid to Shareholders (22,000) 19 Total Cash Flows from Financing Net Change in Cash Balance 104,180 20 (5,600 21 22 23 24 25 26