

Answered step by step
Verified Expert Solution
Question
1 Approved Answer
Please help with Python coding on Jupiter! Data provided below. Employee Salary Age MBA 1 28260 25 No 2 43392 28 Yes 3 56322 37
Please help with Python coding on Jupiter! Data provided below.
| Employee | Salary | Age | MBA |
| 1 | 28260 | 25 | No |
| 2 | 43392 | 28 | Yes |
| 3 | 56322 | 37 | Yes |
| 4 | 26086 | 23 | No |
| 5 | 36807 | 32 | No |
| 6 | 57119 | 57 | No |
| 7 | 48907 | 45 | No |
| 8 | 34301 | 32 | No |
| 9 | 31104 | 25 | No |
| 10 | 60054 | 57 | No |
| 11 | 41420 | 42 | No |
| 12 | 36508 | 25 | Yes |
| 13 | 40015 | 38 | No |
| 14 | 48329 | 47 | No |
| 15 | 39849 | 38 | No |
| 16 | 31985 | 31 | No |
| 17 | 59160 | 54 | No |
| 18 | 60335 | 59 | No |
| 19 | 35911 | 32 | No |
| 20 | 57814 | 55 | No |
| 21 | 42377 | 36 | No |
| 22 | 62430 | 60 | No |
| 23 | 46928 | 49 | No |
| 24 | 34403 | 35 | No |
| 25 | 45714 | 32 | Yes |
| 26 | 42247 | 27 | Yes |
| 27 | 54789 | 52 | No |
| 28 | 31702 | 30 | No |
| 29 | 34406 | 33 | No |
| 30 | 84876 | 57 | Yes |
| 31 | 27399 | 24 | No |
| 32 | 55785 | 51 | No |
| 33 | 34649 | 30 | No |
| 34 | 64236 | 61 | No |
| 35 | 50241 | 45 | No |
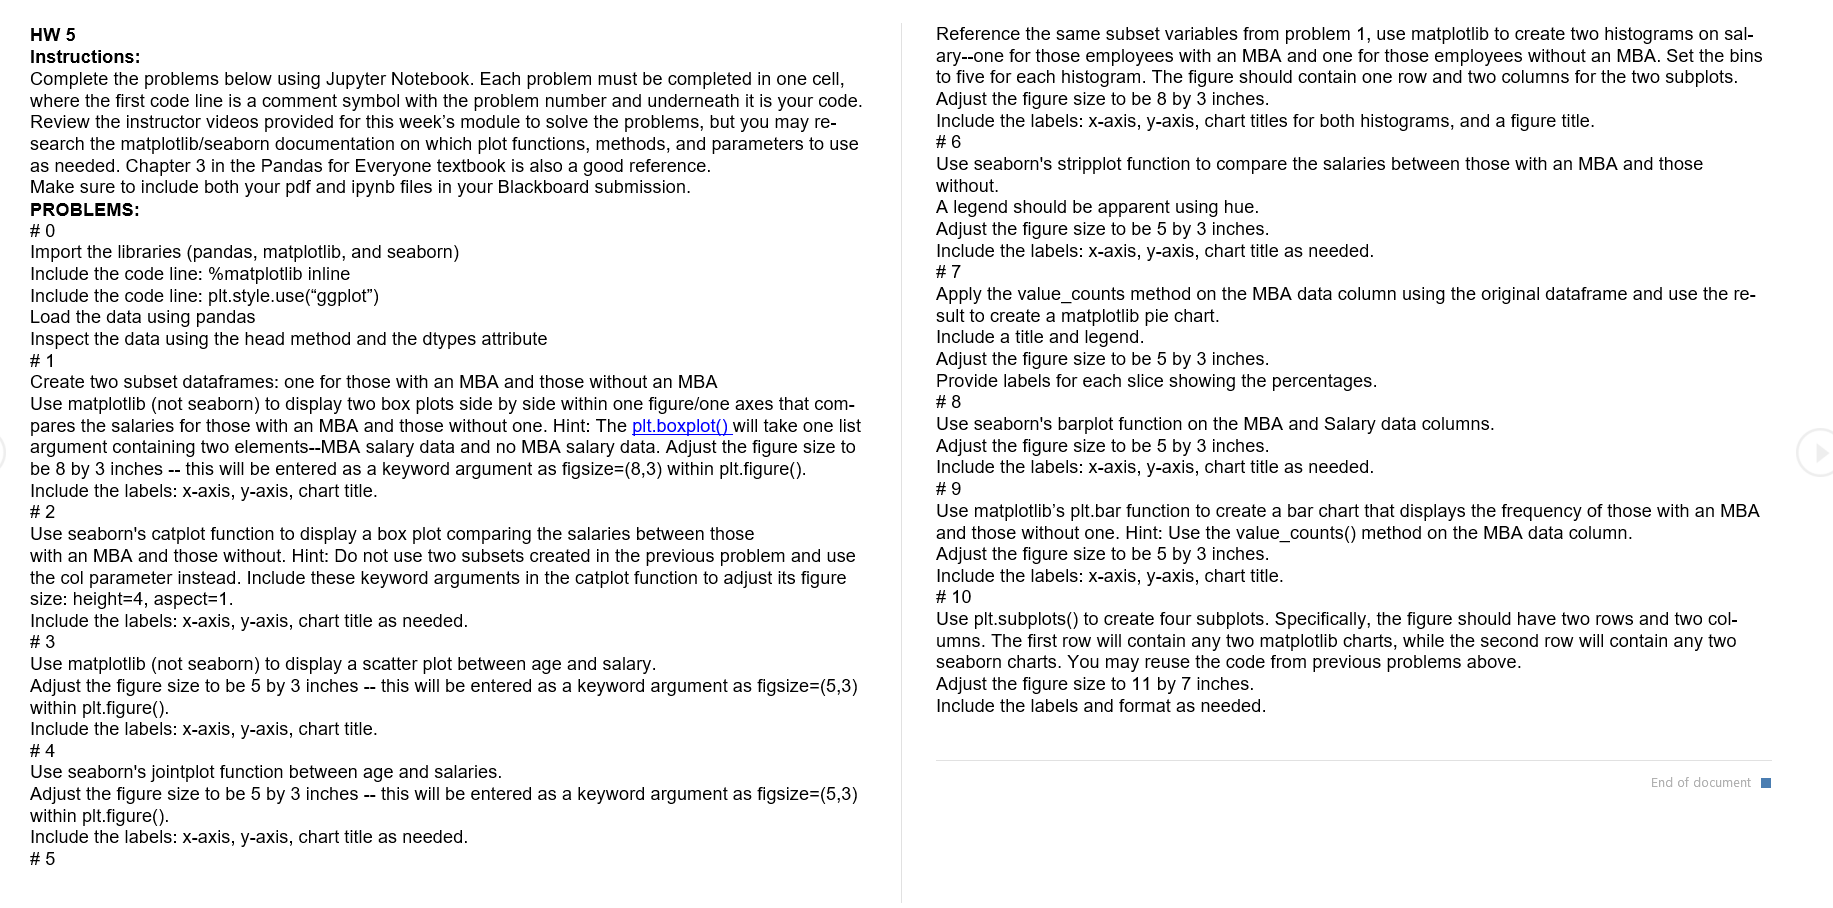
HW 5 Instructions: Complete the problems below using Jupyter Notebook. Each problem must be completed in one cell, where the first code line is a comment symbol with the problem number and underneath it is your code. Review the instructor videos provided for this week's module to solve the problems, but you may re- search the matplotlib/seaborn documentation on which plot functions, methods, and parameters to use as needed. Chapter 3 in the Pandas for Everyone textbook is also a good reference. Make sure to include both your pdf and ipynb files in your Blackboard submission. PROBLEMS: # 0 Import the libraries (pandas, matplotlib, and seaborn) Include the code line: %matplotlib inline Include the code line: plt.style.use("ggplot") Load the data using pandas Inspect the data using the head method and the dtypes attribute # 1 Create two subset dataframes: one for those with an MBA and those without an MBA Use matplotlib (not seaborn) to display two box plots side by side within one figure/one axes that com- pares the salaries for those with an MBA and those without one. Hint: The plt.boxplot() will take one list argument containing two elements--MBA salary data and no MBA salary data. Adjust the figure size to be 8 by 3 inches -- this will be entered as a keyword argument as figsize=(8,3) within plt.figure(). Include the labels: x-axis, y-axis, chart title. # 2 Use seaborn's catplot function to display a box plot comparing the salaries between those with an MBA and those without. Hint: Do not use two subsets created in the previous problem and use the col parameter instead. Include these keyword arguments in the catplot function to adjust its figure size: height=4, aspect=1. Include the labels: X-axis, y-axis, chart title as needed. # 3 Use matplotlib (not seaborn) to display a scatter plot between age and salary. Adjust the figure size to be 5 by 3 inches -- this will be entered as a keyword argument as figsize=(5,3) within pit.figure(). Include the labels: X-axis, y-axis, chart title. #4 Use seaborn's jointplot function between age and salaries. Adjust the figure size to be 5 by 3 inches -- this will be entered as a keyword argument as figsize=(5,3) within pit.figure(). Include the labels: x-axis, y-axis, chart title as needed. # 5 Reference the same subset variables from problem 1, use matplotlib to create two histograms on sal- ary--one for those employees with an MBA and one for those employees without an MBA. Set the bins to five for each histogram. The figure should contain one row and two columns for the two subplots. Adjust the figure size to be 8 by 3 inches. Include the labels: X-axis, y-axis, chart titles for both histograms, and a figure title. #6 Use seaborn's stripplot function to compare the salaries between those with an MBA and those without. A legend should be apparent using hue. Adjust the figure size to be 5 by 3 inches. Include the labels: X-axis, y-axis, chart title as needed. #7 Apply the value_counts method on the MBA data column using the original dataframe and use the re- sult to create a matplotlib pie chart. Include a title and legend. Adjust the figure size to be 5 by 3 inches. Provide labels for each slice showing the percentages. #8 Use seaborn's barplot function on the MBA and Salary data columns. Adjust the figure size to be 5 by 3 inches. Include the labels: X-axis, y-axis, chart title as needed. # 9 Use matplotlib's plt.bar function to create a bar chart that displays the frequency of those with an MBA and those without one. Hint: Use the value_counts() method on the MBA data column. Adjust the figure size to be 5 by 3 inches. Include the labels: X-axis, y-axis, chart title. # 10 Use plt.subplots() to create four subplots. Specifically, the figure should have two rows and two col- umns. The first row will contain any two matplotlib charts, while the second row will contain any two seaborn charts. You may reuse the code from previous problems above. Adjust the figure size to 11 by 7 inches. Include the labels and format as needed. End of document
Step by Step Solution
There are 3 Steps involved in it
Step: 1

Get Instant Access to Expert-Tailored Solutions
See step-by-step solutions with expert insights and AI powered tools for academic success
Step: 2

Step: 3
Ace Your Homework with AI
Get the answers you need in no time with our AI-driven, step-by-step assistance
Get Started
Readings In Database Systems
Authors: Michael Stonebraker
2nd Edition
0934613656, 9780934613651