

Answered step by step
Verified Expert Solution
Question
1 Approved Answer
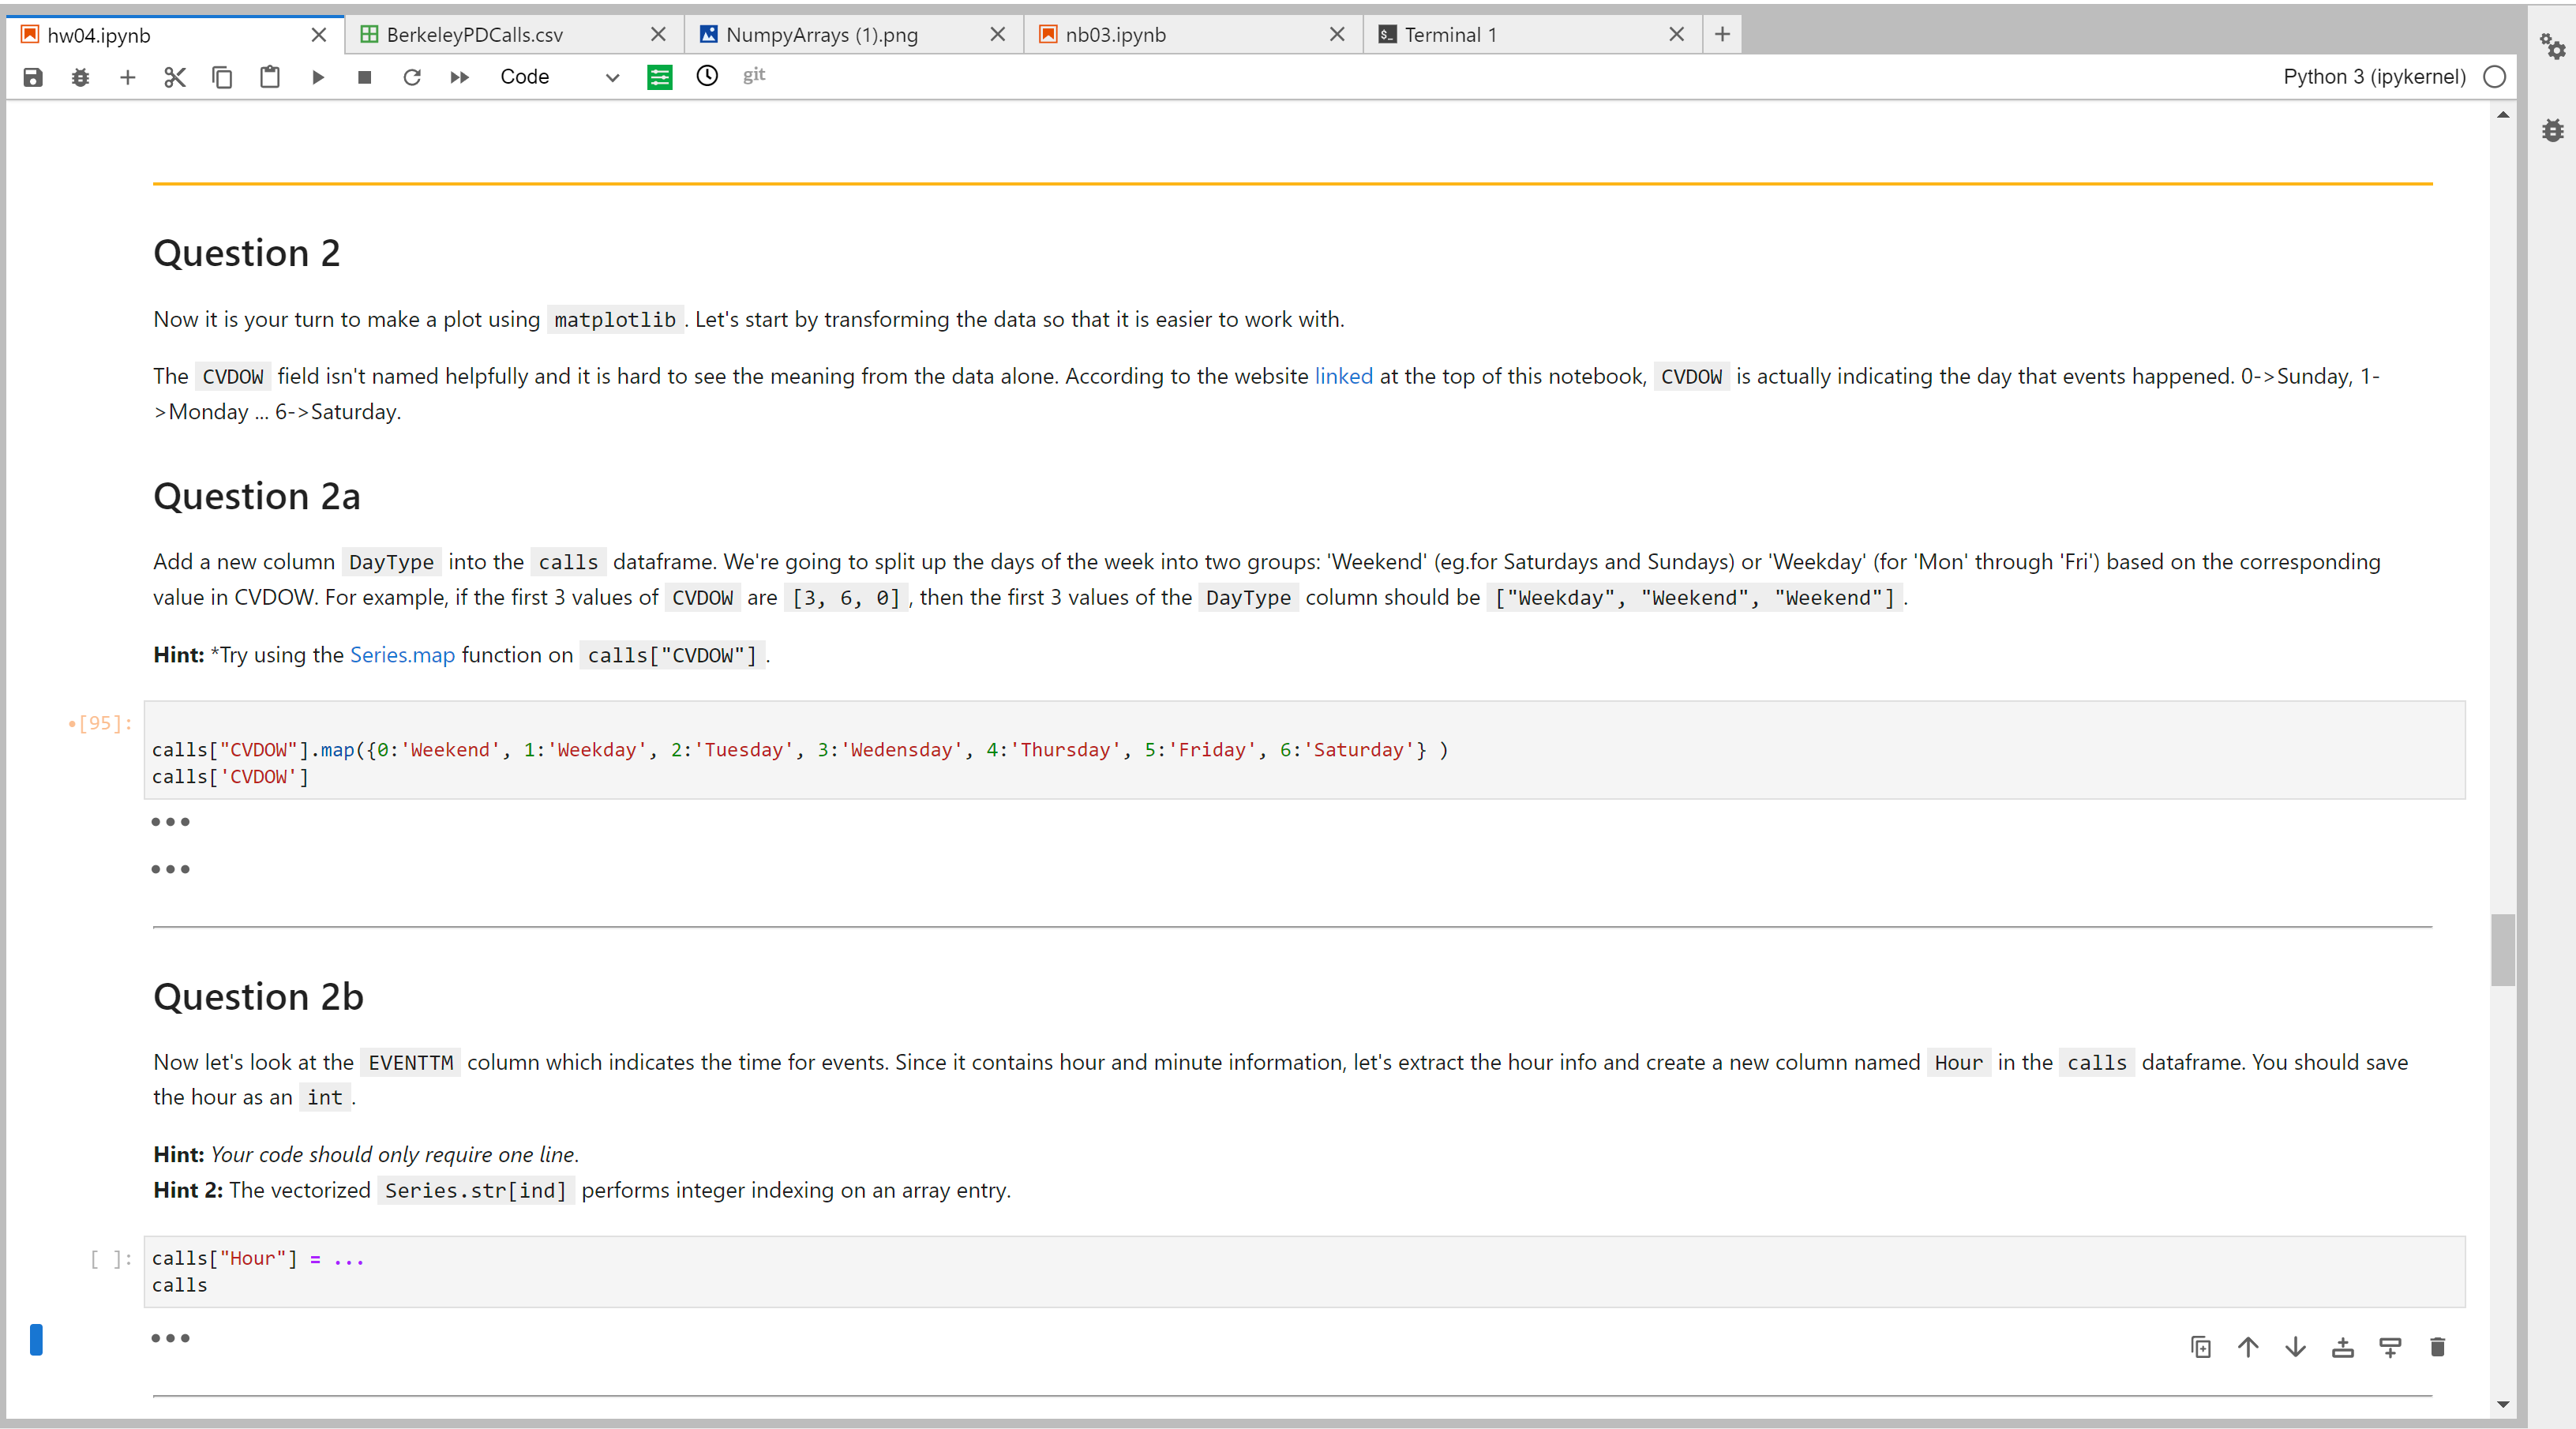
Please help with python pandas and myplotlib questions 2 a and 2 bQuestion 2 Now it is your turn to make a plot using matplotlib.
Please help with python pandas and myplotlib questions a and bQuestion
Now it is your turn to make a plot using matplotlib. Let's start by transforming the data so that it is easier to work with.Question a
Hint: Try using the Series.map function on callsCVDOW
callsCVDOWmap:'Weekend', :'Weekday', :'Tuesday', :'Wedensday' :'Thursday :'Friday', :'Saturday'
calls 'CVDOW'
Question a
Step by Step Solution
There are 3 Steps involved in it
Step: 1

Get Instant Access to Expert-Tailored Solutions
See step-by-step solutions with expert insights and AI powered tools for academic success
Step: 2

Step: 3
Ace Your Homework with AI
Get the answers you need in no time with our AI-driven, step-by-step assistance
Get Started
Oracle Autonomous Database In Enterprise Architecture
Authors: Bal Mukund Sharma, Krishnakumar KM, Rashmi Panda
1st Edition
1801072248, 978-1801072243