

Question
PLEASE HELP WITH QUESTION 2 AND 3 MASS OF TEA BAG=1.895 TA IN TEA LEAVES=2.519x10^-4 CONCENTRATION OF TA IN PURE TEA= 9M PH OF PURE
PLEASE HELP WITH QUESTION 2 AND 3
MASS OF TEA BAG=1.895
TA IN TEA LEAVES=2.519x10^-4
CONCENTRATION OF TA IN PURE TEA= 9M
PH OF PURE TEA= 6.75
CONCENTRATION OF H+ FOR PURE TEA=1.7x10^-7
CONCENTRATION OF TAH+ IN PURE TEA 5.0x10^-8
KEQ FOR PURE TEA= 3.27x10^-2
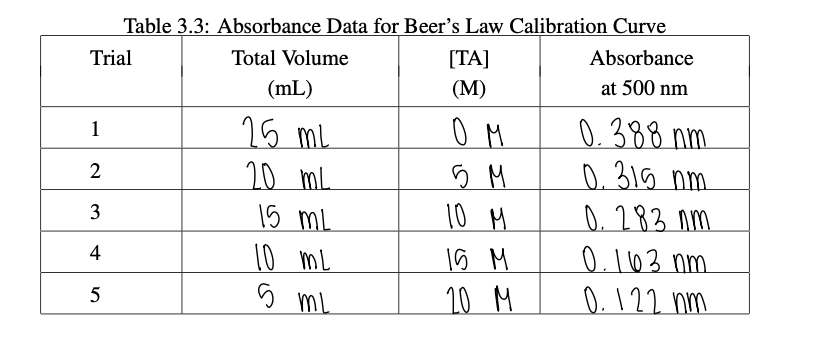
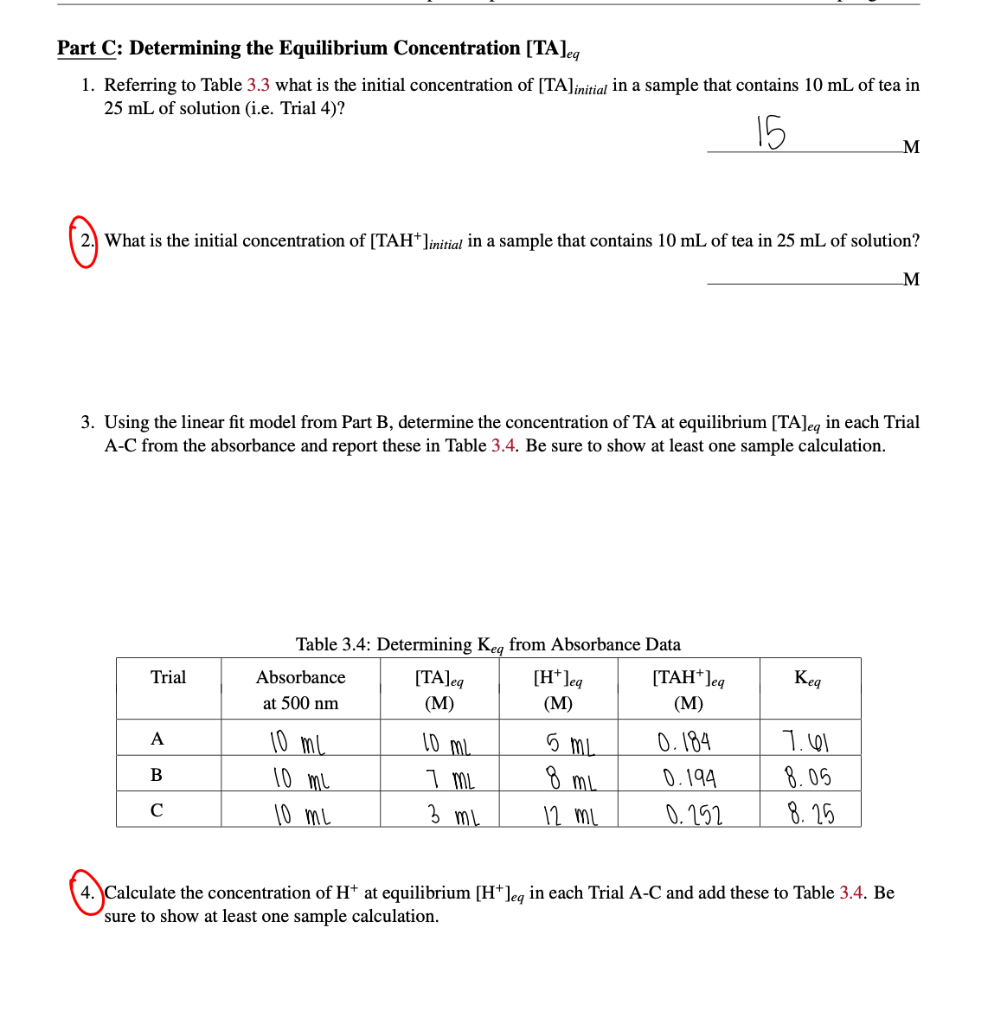
Part C: Determining the Equilibrium Concentration [TA]eq 1. Referring to Table 3.3 what is the initial concentration of [TA]initial in a sample that contains 10mL of tea in 25mL of solution (i.e. Trial 4)? 2. What is the initial concentration of [TAH+]initial in a sample that contains 10mL of tea in 25mL of solution? M 3. Using the linear fit model from Part B, determine the concentration of TA at equilibrium [TA]eq in each Trial A-C from the absorbance and report these in Table 3.4. Be sure to show at least one sample calculation. Table 3.4: Determining Kn from Absorbance Data 4. Calculate the concentration of H+at equilibrium [H+]eq in each Trial A-C and add these to Table 3.4. Be sure to show at least one sample calculation. Table 3.3: Absorbance Data for Beer's Law Calibration Curve \begin{tabular}{|c|c|c|c|} \hline Trial & TotalVolume(mL) & [TA](M) & Absorbanceat500nm \\ \hline 1 & 25mL & 0M & 0.388nm \\ \hline 2 & 20mL & 5M & 0.315nm \\ \hline 3 & 15mL & 10M & 0.283nm \\ \hline 4 & 10mL & 15M & 0.163nm \\ \hline 5 & 5mL & 20M & 0.122nm \\ \hline \end{tabular} Part C: Determining the Equilibrium Concentration [TA]eq 1. Referring to Table 3.3 what is the initial concentration of [TA]initial in a sample that contains 10mL of tea in 25mL of solution (i.e. Trial 4)? 2. What is the initial concentration of [TAH+]initial in a sample that contains 10mL of tea in 25mL of solution? M 3. Using the linear fit model from Part B, determine the concentration of TA at equilibrium [TA]eq in each Trial A-C from the absorbance and report these in Table 3.4. Be sure to show at least one sample calculation. Table 3.4: Determining Kn from Absorbance Data 4. Calculate the concentration of H+at equilibrium [H+]eq in each Trial A-C and add these to Table 3.4. Be sure to show at least one sample calculation. Table 3.3: Absorbance Data for Beer's Law Calibration Curve \begin{tabular}{|c|c|c|c|} \hline Trial & TotalVolume(mL) & [TA](M) & Absorbanceat500nm \\ \hline 1 & 25mL & 0M & 0.388nm \\ \hline 2 & 20mL & 5M & 0.315nm \\ \hline 3 & 15mL & 10M & 0.283nm \\ \hline 4 & 10mL & 15M & 0.163nm \\ \hline 5 & 5mL & 20M & 0.122nm \\ \hline \end{tabular}
Step by Step Solution
There are 3 Steps involved in it
Step: 1

Get Instant Access to Expert-Tailored Solutions
See step-by-step solutions with expert insights and AI powered tools for academic success
Step: 2

Step: 3
Ace Your Homework with AI
Get the answers you need in no time with our AI-driven, step-by-step assistance
Get Started
Chemistry
Authors: John E McMurry, Robert C Fay
5th Edition
136151868, 978-0136151869