Answered step by step
Verified Expert Solution
Question
1 Approved Answer
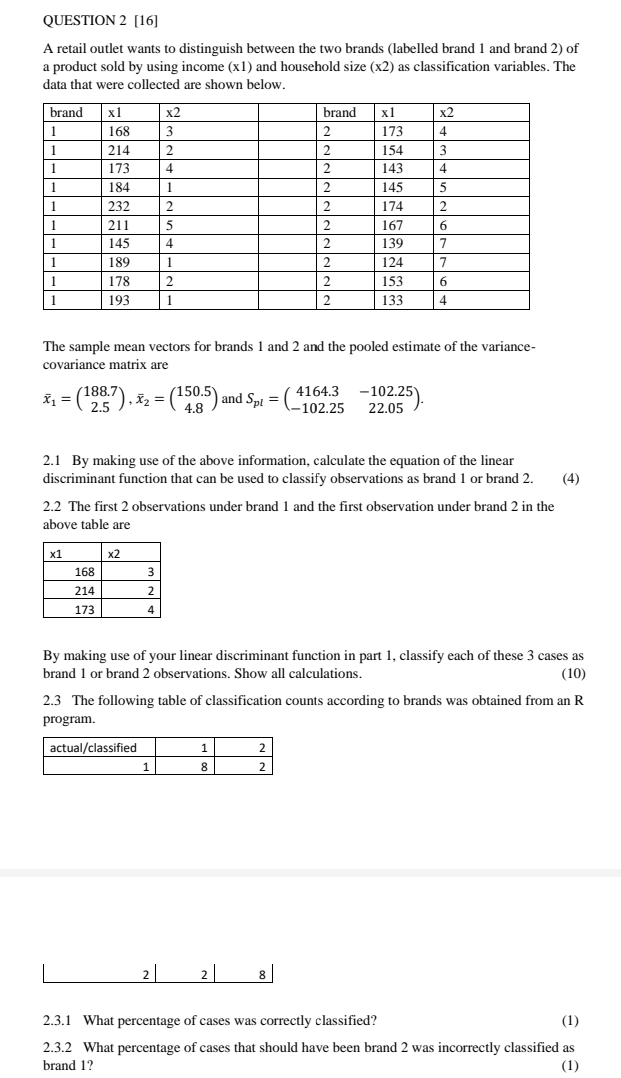
please help with question 2 QUESTION 2 [16] A retail outlet wants to distinguish between the two brands (labelled brand 1 and brand 2) of

please help with question 2
QUESTION 2 [16] A retail outlet wants to distinguish between the two brands (labelled brand 1 and brand 2) of a product sold by using income (x1) and household size (x2) as classification variables. The data that were collected are shown below. brand x2 4 1 x2 3 2 4 1 1 1 brand 2 2 2 2 3 4 5 1 1 x1 168 214 173 184 232 211 145 189 178 193 2 x1 173 154 143 145 174 167 139 124 153 133 2 5 5 4 1 2 2 2 2 2 2 1 6 7 7 1 1 6 1 1 2 1 4 The sample mean vectors for brands 1 and 2 and the pooled estimate of the variance- covariance matrix are z = (10.3+), 82 = (15935) and Sp1 = (-11 50.5 4.8 4164.3 -102.25 - 102.25 22.05 2.1 By making use of the above information, calculate the equation of the linear discriminant function that can be used to classify observations as brand 1 or brand 2. (4) 2.2 The first 2 observations under brand 1 and the first observation under brand 2 in the above table are x1 x2 168 3 214 2 173 4 By making use of your linear discriminant function in part 1, classify each of these 3 cases as brand 1 or brand 2 observations. Show all calculations. (10) 2.3 The following table of classification counts according to brands was obtained from an R program. actual/classified 1 2 2 1 8 2 21 |2|| 8 2.3.1 What percentage of cases was correctly classified? (1) 2.3.2 What percentage of cases that should have been brand 2 was incorrectly classified as brand 1? (1) QUESTION 2 [16] A retail outlet wants to distinguish between the two brands (labelled brand 1 and brand 2) of a product sold by using income (x1) and household size (x2) as classification variables. The data that were collected are shown below. brand x2 4 1 x2 3 2 4 1 1 1 brand 2 2 2 2 3 4 5 1 1 x1 168 214 173 184 232 211 145 189 178 193 2 x1 173 154 143 145 174 167 139 124 153 133 2 5 5 4 1 2 2 2 2 2 2 1 6 7 7 1 1 6 1 1 2 1 4 The sample mean vectors for brands 1 and 2 and the pooled estimate of the variance- covariance matrix are z = (10.3+), 82 = (15935) and Sp1 = (-11 50.5 4.8 4164.3 -102.25 - 102.25 22.05 2.1 By making use of the above information, calculate the equation of the linear discriminant function that can be used to classify observations as brand 1 or brand 2. (4) 2.2 The first 2 observations under brand 1 and the first observation under brand 2 in the above table are x1 x2 168 3 214 2 173 4 By making use of your linear discriminant function in part 1, classify each of these 3 cases as brand 1 or brand 2 observations. Show all calculations. (10) 2.3 The following table of classification counts according to brands was obtained from an R program. actual/classified 1 2 2 1 8 2 21 |2|| 8 2.3.1 What percentage of cases was correctly classified? (1) 2.3.2 What percentage of cases that should have been brand 2 was incorrectly classified as brand 1? (1)Step by Step Solution
There are 3 Steps involved in it
Step: 1

Get Instant Access to Expert-Tailored Solutions
See step-by-step solutions with expert insights and AI powered tools for academic success
Step: 2

Step: 3

Ace Your Homework with AI
Get the answers you need in no time with our AI-driven, step-by-step assistance
Get Started


