Answered step by step
Verified Expert Solution
Question
1 Approved Answer
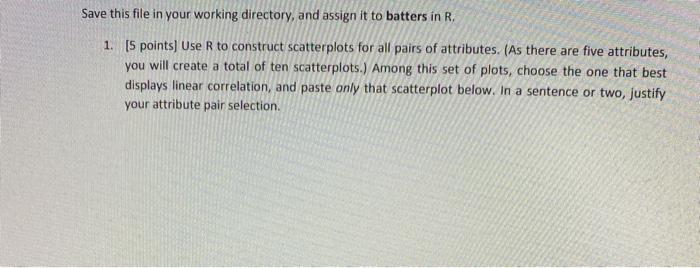
please help with R program LeMahieu 0.327 61 312 0.893 1.95 Urshela 0.314 55 236 0.889 3.48 Torres 0.278 64 292 0.871 2.64 Judge 0.272
please help with R program 


LeMahieu 0.327 61 312 0.893 1.95
Urshela 0.314 55 236 0.889 3.48
Torres 0.278 64 292 0.871 2.64
Judge 0.272 46 204 0.921 2.21
Sanchez 0.232 47 208 0.841 3.13
Wong 0.285 40 202 0.784 1.76
Molina 0.27 34 167 0.711 2.52
Goldschmidt 0.26 60 284 0.821 2.13
Ozuna 0.243 53 230 0.804 1.84
DeJong 0.233 62 259 0.762 2.39
Altuve 0.298 61 275 0.903 1.98
Bregman 0.296 80 328 1.015 0.69
Springer 0.292 62 283 0.974 1.69
Reddick 0.275 36 205 0.728 1.83
Chirinos 0.238 40 162 0.791 2.45
Bellinger 0.305 84 351 1.035 1.14
Turner 0.29 51 244 0.881 1.72
Seager 0.272 64 236 0.817 2.23
Taylor 0.262 45 169 0.794 3.11
Muncy 0.251 58 251 0.889 1.65
Meadows 0.291 69 296 0.922 2.43
Garcia 0.282 47 227 0.796 4.03
Pham 0.273 56 255 0.818 1.52
Choi 0.261 41 188 0.822 1.69
Adames 0.254 46 222 0.735 3.32
Yelich 0.329 76 328 1.101 1.48
Braun 0.285 55 232 0.849 3.09
Moustakas 0.254 66 270 0.845 1.85
Grandal 0.246 56 240 0.848 1.28
Arcia 0.223 32 173 0.633 2.53
Step by Step Solution
There are 3 Steps involved in it
Step: 1

Get Instant Access to Expert-Tailored Solutions
See step-by-step solutions with expert insights and AI powered tools for academic success
Step: 2

Step: 3

Ace Your Homework with AI
Get the answers you need in no time with our AI-driven, step-by-step assistance
Get Started


