Please help with the following assignment (will give helpful rating):
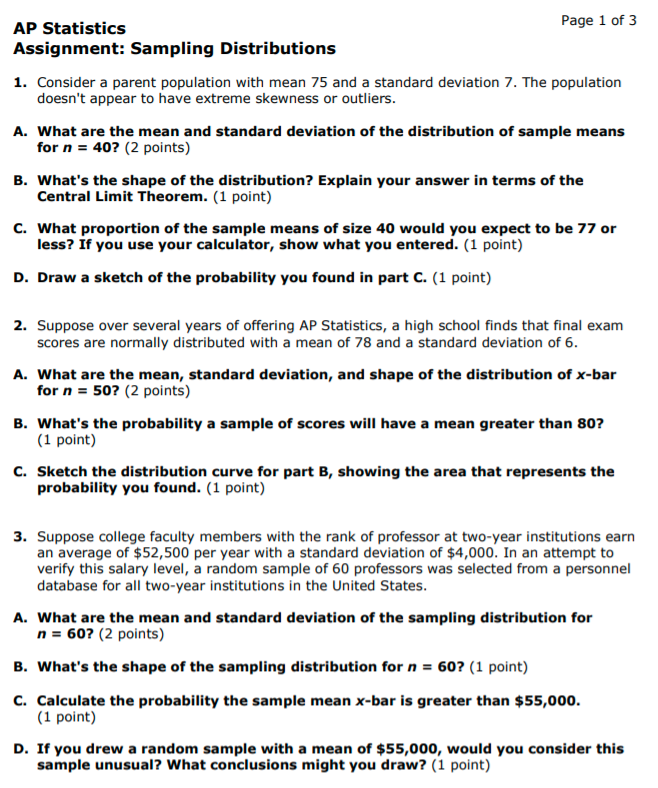
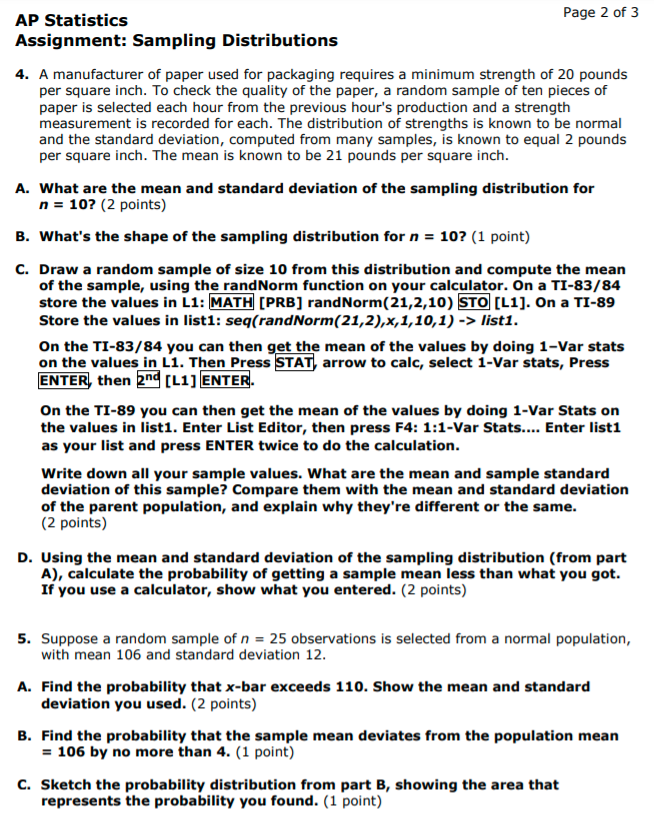
AP Statistics Page 1 of 3 Assignment: Sampling Distributions 1. Consider a parent population with mean 75 and a standard deviation 7. The population doesn't appear to have extreme skewness or outliers. A. What are the mean and standard deviation of the distribution of sample means for n = 40? (2 points) B. What's the shape of the distribution? Explain your answer in terms of the Central Limit Theorem. (1 point) C. What proportion of the sample means of size 40 would you expect to be 77 or less? If you use your calculator, show what you entered. (1 point) D. Draw a sketch of the probability you found in part C. (1 point) 2. Suppose over several years of offering AP Statistics, a high school finds that final exam scores are normally distributed with a mean of 78 and a standard deviation of 6. A. What are the mean, standard deviation, and shape of the distribution of x-bar for n = 50? (2 points) B. What's the probability a sample of scores will have a mean greater than 80? (1 point) C. Sketch the distribution curve for part B, showing the area that represents the probability you found. (1 point) 3. Suppose college faculty members with the rank of professor at two-year institutions earn an average of $52,500 per year with a standard deviation of $4,000. In an attempt to verify this salary level, a random sample of 60 professors was selected from a personnel database for all two-year institutions in the United States. A. What are the mean and standard deviation of the sampling distribution for n = 60? (2 points) B. What's the shape of the sampling distribution for n = 60? (1 point) C. Calculate the probability the sample mean x-bar is greater than $55,000. (1 point) D. If you drew a random sample with a mean of $55,000, would you consider this sample unusual? What conclusions might you draw? (1 point)AP Statistics Page 2 of 3 Assignment: Sampling Distributions 4. 'I Ce A manufacturer of paper used for packaging requires a minimum strength of 20 pounds per square inch. To check the quality of the paper, a random sample of ten pieces of paper is selected each hour from the previous heur's production and a strength measumment is recorded for each. The distribution of strengths is known to be normal and the standard cleiiriatiii-n,r computed from many samples, Is known to equal 2 pounds per square inch. The mean ls known to be 21 pounds per square inch. . 1iiil'hat are the mean and standard deviation of the sampling distribution for ri = 10? (2 points) . 1iiil'hat's the shape of the sampling distribution for n = 10? (1 point} Draw a random sample of size 10 from this distribution and oompute the mean of the sample, using the randllierm function on your ealoulator. On a T1433!\" store the values in L1: [one] ranenenn{21.2,1o) [L1]. On a 11419 Store the values in Ilst1: segfrandonnf21,2),x,1,la,1) -> iistl. On the 11-83! 84 you can then et the mean of the values by doing 1Var stats on the values in L1. Then Press arrow to sale. select 1-Var stats, Press then E153 [Lum- On the 11-89 you can then get the mean of the values by doing 1-Var Stats on the values In Ilst:l.. Enter Llst Editor, then press F4: 1:1'ii'ar Stats... Enter list: as your list and press ENTER twins to do the calculation. Write down all your sample values. 1iiilhat are the mean and sample standard deviation of this sample? Compare them with the mean and standard deviation of the parent population. and explain why they're different or the same. (2 points) Using the mean and standard deviation of the sampling distribution (from pert A). calculate the probability of getting a sample mean less than what you get. It you use a calculator, shoutr what you entered. (2 points) Suppose a random sample Of :1 I5 25 observations is SEIEEUEU from a normal DODUIE'ZIOH, with mean 105 and standard deviation 12. Find the problblllty that x-bar exceeds 110. Show the mean and standard deviation you used. (2 points) Find the probability that the sample mean deviates from the population mean - me by no more than 4. (1 point) Sketch the probability distribution from part ii. showing the area that represents the probability you found. (1 point]


