Answered step by step
Verified Expert Solution
Link Copied!

Question

1 Approved Answer

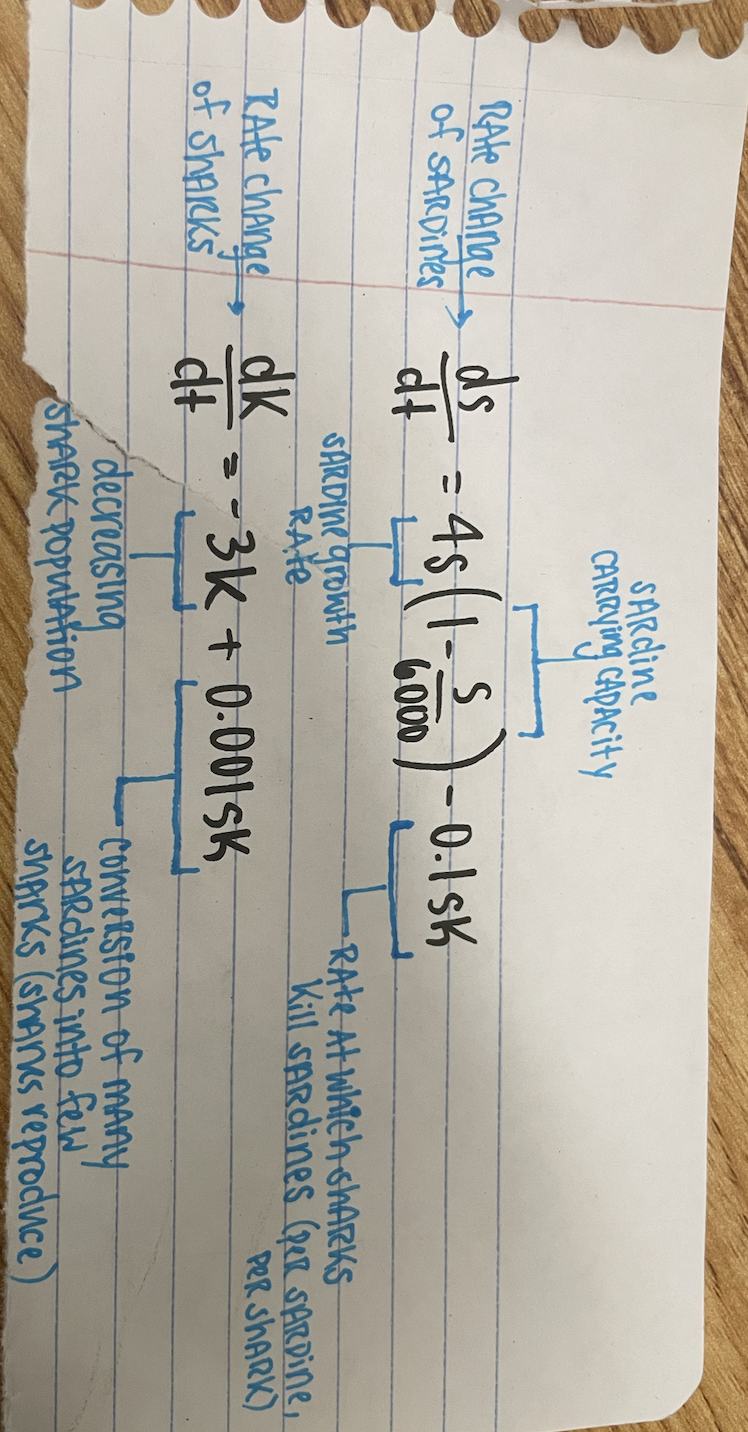
please help with the following explanations b-h. variables are defined in the second image Let s(t) be the number of sardines and k(t) be the

please help with the following explanations b-h. variables are defined in the second image
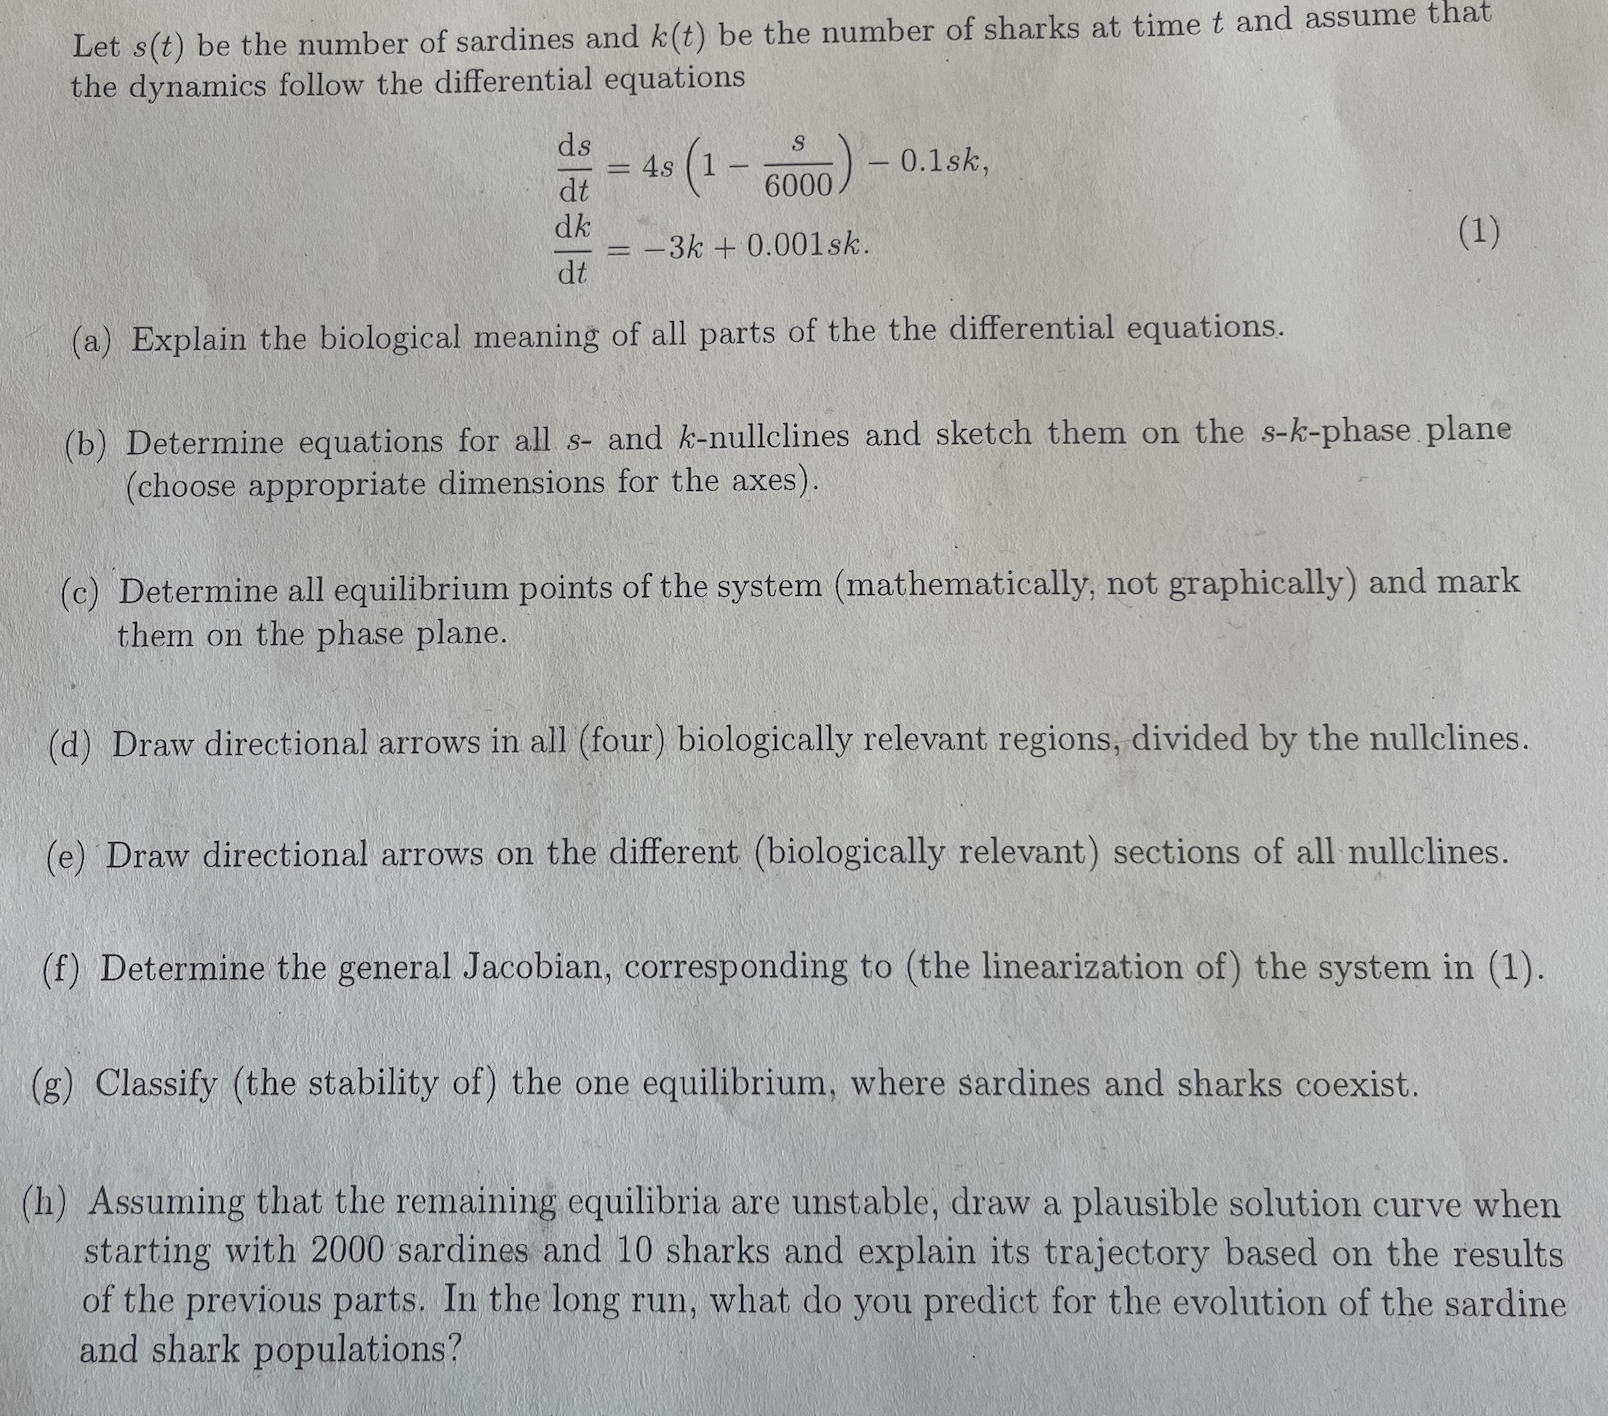
image text in transcribedimage text in transcribed
Let s(t) be the number of sardines and k(t) be the number of sharks at time t and assume that the dynamics follow the differential equations ds S = 4s (1 6000 - 0.1sk, at dk -3k + 0.001sk. (1) at (a) Explain the biological meaning of all parts of the the differential equations. (b) Determine equations for all s- and k-nullclines and sketch them on the s-k-phase plane (choose appropriate dimensions for the axes). (c) Determine all equilibrium points of the system (mathematically, not graphically) and mark them on the phase plane. (d) Draw directional arrows in all (four) biologically relevant regions, divided by the nullclines. (e) Draw directional arrows on the different (biologically relevant) sections of all nullclines. (f) Determine the general Jacobian, corresponding to (the linearization of ) the system in (1). g) Classify (the stability of) the one equilibrium, where sardines and sharks coexist. (h) Assuming that the remaining equilibria are unstable, draw a plausible solution curve when starting with 2000 sardines and 10 sharks and explain its trajectory based on the results of the previous parts. In the long run, what do you predict for the evolution of the sardine and shark populations?SARdine CARRYing CAPAcity Rate Change -S of SARDines = 45 ( 1-S - 0. ISK 6000 SARDine growth RAte At which sharks RAfe Kill SARdines (Per SARDine RAfe change of sharks - 3 K + 0.0015K PER SHARK) decreasing conversion of many SHARK population SARdines into few sharks (shares reproduce

Step by Step Solution

There are 3 Steps involved in it

Step: 1

blur-text-image

Get Instant Access to Expert-Tailored Solutions

See step-by-step solutions with expert insights and AI powered tools for academic success

Step: 2

blur-text-image_2

Step: 3

blur-text-image_3

Ace Your Homework with AI

Get the answers you need in no time with our AI-driven, step-by-step assistance

Get Started

Recommended Textbook for

Quantitative Analysis For Management

Authors: Barry Render, Ralph M. Stair, Michael E. Hanna

11th Edition

9780132997621, 132149117, 132997622, 978-0132149112

Students also viewed these Mathematics questions

Question

How can NAFTA be beneficial to suppliers of Walmart?

Answered: 1 week ago