

Question
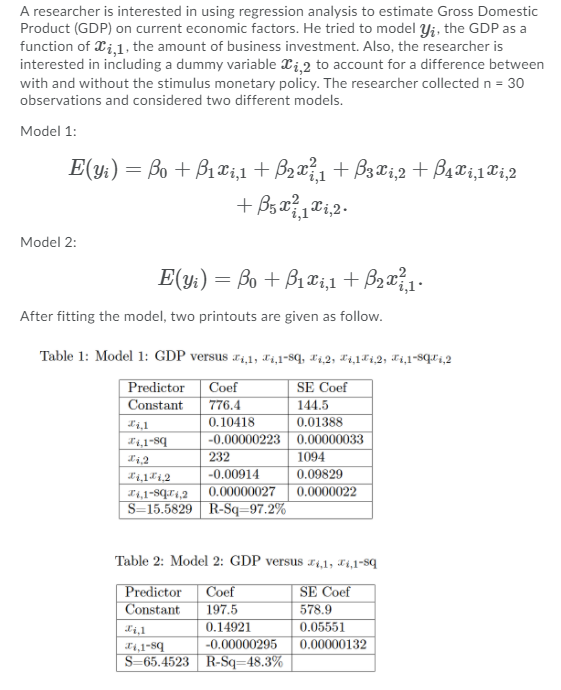
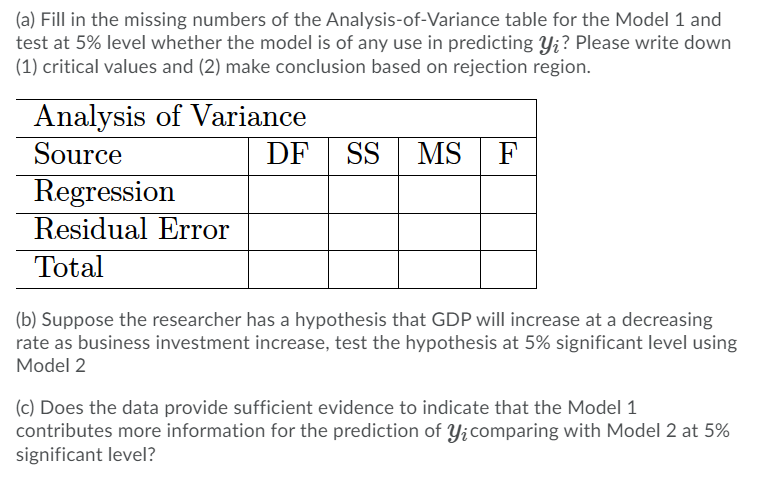
Please help with the following statistics question. The first attachment is the background information, the second is the question: A researcher is interested in using
Please help with the following statistics question. The first attachment is the background information, the second is the question:
Step by Step Solution
There are 3 Steps involved in it
Step: 1

Get Instant Access to Expert-Tailored Solutions
See step-by-step solutions with expert insights and AI powered tools for academic success
Step: 2

Step: 3
Ace Your Homework with AI
Get the answers you need in no time with our AI-driven, step-by-step assistance
Get Started
Applied Regression Analysis And Other Multivariable Methods
Authors: David G. Kleinbaum, Lawrence L. Kupper, Azhar Nizam, Eli S. Rosenberg
5th Edition
1285051084, 978-1285963754, 128596375X, 978-1285051086