 Please help with the rest of the Profitability and please show work. All information are provided above!
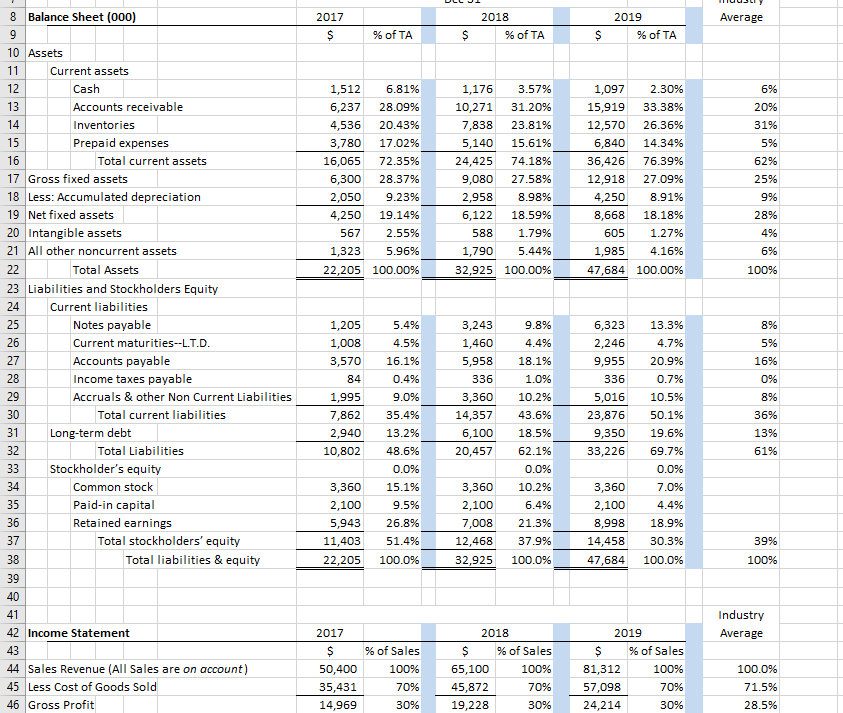
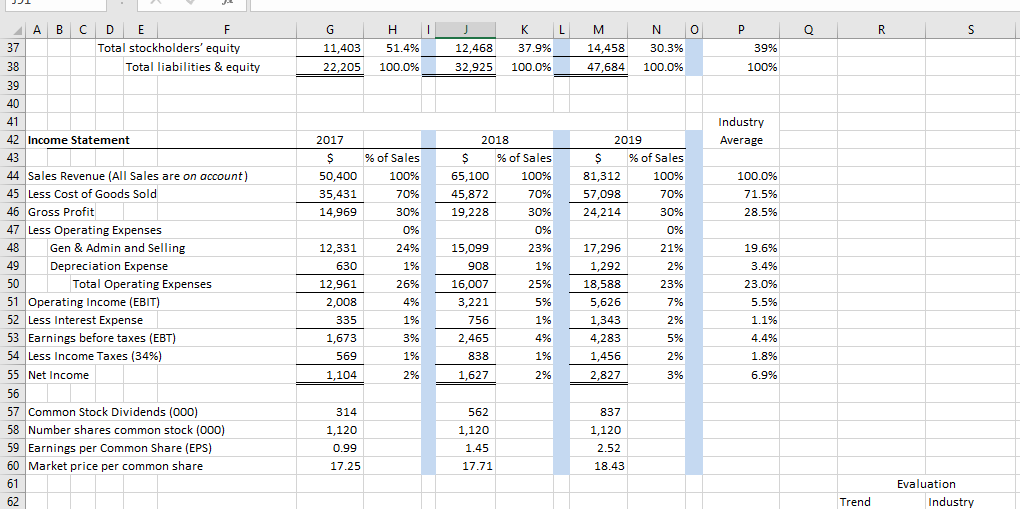
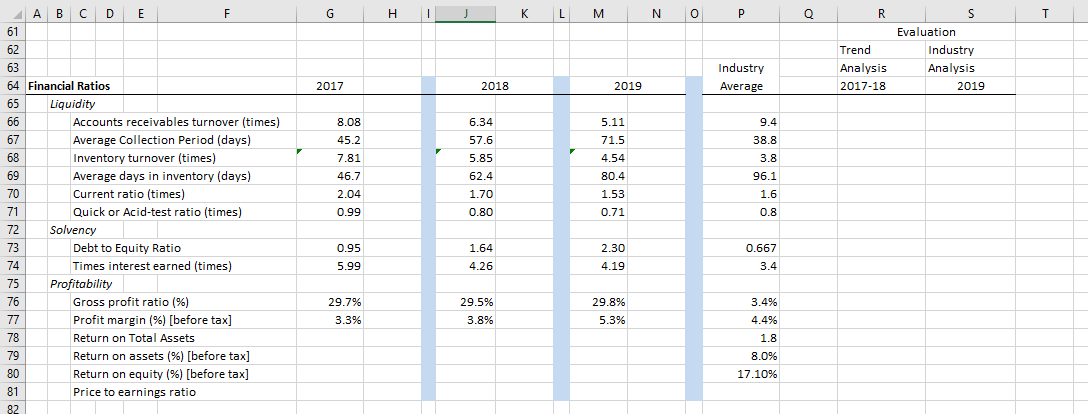
Average 2017 $ 2018 % of TA 2019 % of TA % of TA $ $ 6% 20% 31% 5% 1,512 6.81% 6,237 28.09% 4,536 20.43% 3,780 17.02% 16,065 72.35% 6,300 28.37% 2,050 9.23% 4,250 19.14% 567 2.55% 1,323 5.96% 22,205 100.00% 1,176 3.57% 10,271 31.20% 7,838 23.81% 5,140 15.61% 24,425 74.18% 9,080 27.58% 2,958 8.98% 6,122 18.59% 588 1.79% 1,790 5.44% 32,925 100.00% 1,097 2.30% 15,919 33.38% 12,570 26.36% 6,840 14.34% 36,426 76.39% 12,918 27.09% 4,250 8.91% 8,668 18.18% 605 1.27% 1,985 4.16% 47,684 100.00% 62% 25% 9% 28% 4% 6% 100% 5.4% 8% 8 Balance Sheet (000) 9 10 Assets 11 Current assets 12 Cash 13 Accounts receivable 14 Inventories 15 Prepaid expenses 16 Total current assets 17 Gross fixed assets 18 Less: Accumulated depreciation 19 Net fixed assets 20 Intangible assets 21 All other noncurrent assets 22 Total Assets 23 Liabilities and Stockholders Equity 24 Current liabilities 25 Notes payable 26 Current maturities--L.T.D. 27 Accounts payable 28 Income taxes payable 29 Accruals & other Non Current Liabilities 30 Total current liabilities 31 Long-term debt 32 Total Liabilities 33 Stockholder's equity 34 Common stock 35 Paid-in capital 36 Retained earnings 37 Total stockholders' equity 38 Total liabilities & equity 39 40 41 42 Income Statement 43 44 Sales Revenue (All Sales are on account) 45 Less Cost of Goods Sold 46 Gross Profit 1,205 1,008 3,570 84 1,995 7,862 2,940 10,802 5% 16% 0% 9.8% 4.4% 18.1% 1.0% 10.2% 43.6% 3,243 1,460 5,958 336 3,360 14,357 6,100 20,457 4.5% 16.1% 0.4% 9.0% 35.4% 13.2% 48.6% 0.0% 15.1% 9.5% 26.8% 51.4% 100.0% 6,323 2,246 9,955 336 5,016 23,876 9,350 33,226 8% 13.3% 4.7% 20.9% 0.7% 10.5% 50.1% 19.6% 69.7% 0.0% 7.0% 4.4% 18.9% 36% 13% 61% 3,360 2,100 5,943 11,403 22,205 3,360 2,100 7,008 12,468 32,925 18.5% 62.1% 0.0% 10.2% 6.4% 21.3% 37.9% 3,360 2,100 8,998 14,458 47,684 30.3% 100.0% 39% 100% 100.0% Industry Average 2017 $ % of Sales 50,400 100% 35,431 70% 14,969 30% 2018 $ % of Sales 65,100 100% 45,872 70% 19,228 30% 2019 $ % of Sales 81,312 100% 57,098 70% 24,214 30% 100.0% 71.5% 28.5% 1 J L N 0 Q R S 37 C D E F Total stockholders' equity Total liabilities & equity G 11,403 22,205 H 51.4% 12,468 32,925 37.9% 100.0% M 14,458 47,684 30.3% 100.0% P 39% 100% 100.0% 38 39 40 41 Industry Average 2017 $ 50,400 35,431 14,969 % of Sales 100% 70% 30% 0% 100.0% 71.5% 28.5% 24% 1% 42 Income Statement 43 44 Sales Revenue (All Sales are on account) 45 Less Cost of Goods Sold 46 Gross Profit 47 Less Operating Expenses 48 Gen & Admin and Selling 49 Depreciation Expense 50 Total Operating Expenses 51 Operating Income (EBIT) 52 Less Interest Expense 53 Earnings before taxes (EBT) 54 Less Income Taxes (34%) 55 Net Income 56 57 Common Stock Dividends (000) 58 Number shares common stock (000) ) 59 Earnings per Common Share (EPS) 60 Market price per common share 61 62 12,331 630 12,961 2,008 335 1,673 569 1,104 2018 $ % of Sales 65,100 100% 45,872 70% 19,228 30% 0% 15,099 23% 908 1% 16,007 25% 3,221 5% 756 1% 2,465 4% 838 1% 1,627 2% 2019 $ % of Sales 81,312 100% 57,098 70% 24,214 30% 0% 17,296 21% 1,292 2% 18,588 23% 5,626 7% 1,343 2% 4,283 5% 1,456 2% 2,827 3% 26% 4% 1% 19.6% 3.4% 23.0% 5.5% 1.1% 4.4% 1.8% 6.9% 3% 1% 2% 314 1,120 0.99 17.25 562 1,120 1.45 17.71 837 1,120 2.52 18.43 Evaluation Industry Trend G K L M N 0 P Q R T Trend Analysis 2017-18 Industry Average S Evaluation Industry Analysis 2019 2017 2018 2019 11.30 A B C D F F 61 62 63 64 Financial Ratios 65 Liquidity 66 Accounts receivables turnover (times) 67 Average Collection Period (days) 68 Inventory turnover (times) 69 Average days in inventory (days) 70 Current ratio (times) 71 Quick or Acid-test ratio (times) 72 Solvency 73 Debt to Equity Ratio 74 Times interest earned (times) 75 Profitability 76 Gross profit ratio (%) 77 Profit margin (%) [before tax] 78 Return on Total Assets 79 Return on assets (%) [before tax] 80 Return on equity (%) [before tax] 81 Price to earnings ratio 82 8.08 45.2 7.81 46.7 2.04 0.99 6.34 57.6 5.85 62.4 1.70 0.80 5.11 71.5 4.54 80.4 1.53 0.71 9.4 38.8 3.8 96.1 1.6 0.8 0.95 5.99 1.64 4.26 2.30 4.19 0.667 3.4 29.7% 29.5% 29.8% 5.3% 3.3% 3.8% 3.4% 4.4% 1.8 8.0% 17.10%