

Question: please help with these 3 multi choice quesrion. thank you A scatterplot is best used for which of the following objectives? Indicating trends. Showing relationships.
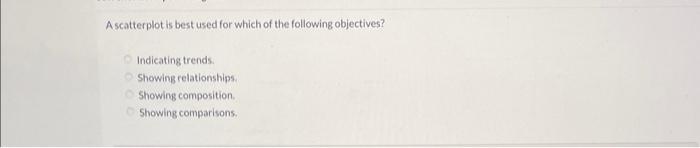
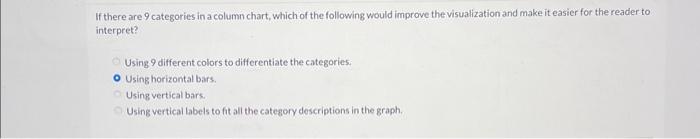
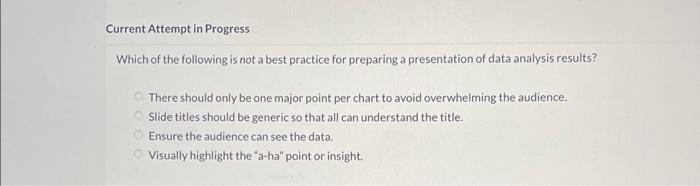
A scatterplot is best used for which of the following objectives? Indicating trends. Showing relationships. Showing composition. Showing comparisons. If there are 9 categories in a column chart, which of the following would improve the visualization and make it easier for the reader to interpret? Using 9 different colors to differentiate the categories: Using horizontal bars. Using vertical bars. Using vertical labels to fit all the category descriptions in the graph. Which of the following is not a best practice for preparing a presentation of data analysis results? There should only be one major point per chart to avoid overwhelming the audience. Slide titles should be generic so that all can understand the title. Ensure the audience can see the data. Visually highlight the "a-ha" point or insight
Step by Step Solution
There are 3 Steps involved in it

Get step-by-step solutions from verified subject matter experts