Please help with this assignment, I will give you a thumbs up
NEED Excel (with a link) please


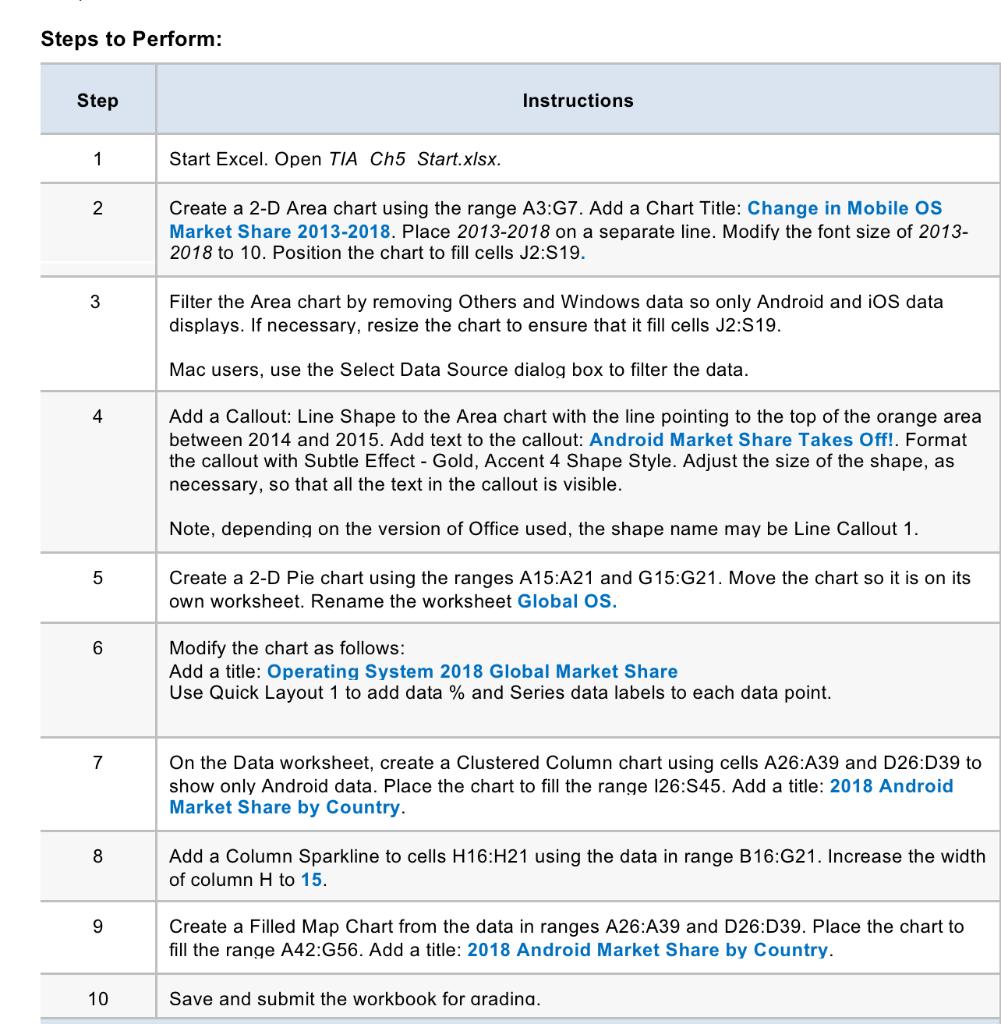
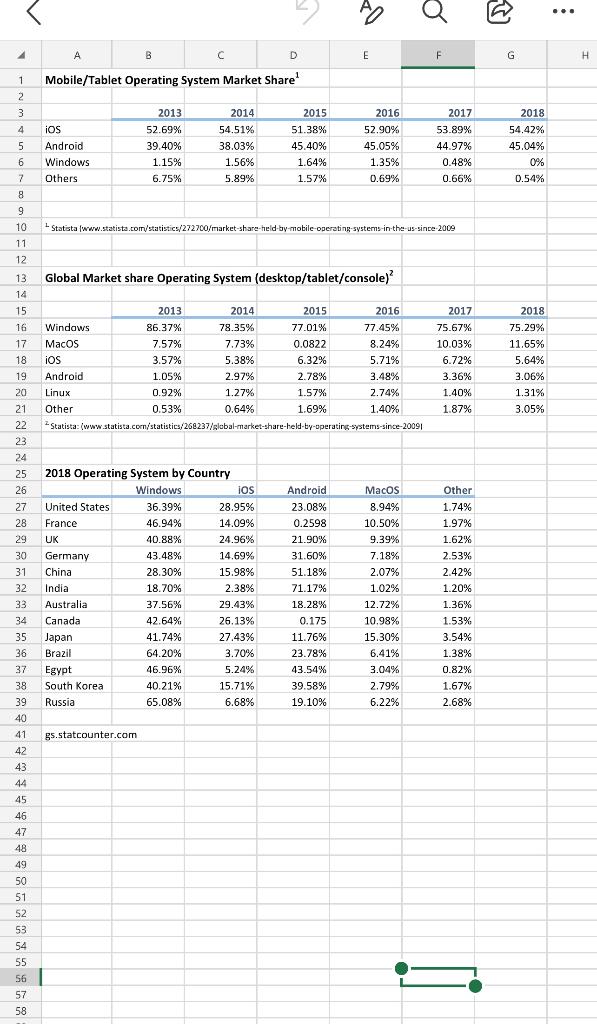
Steps to Perform: Step 1 2 3 4 5 6 7 8 9 10 Start Excel. Open TIA Ch5 Start.xlsx. Instructions Create a 2-D Area chart using the range A3:G7. Add a Chart Title: Change in Mobile OS Market Share 2013-2018. Place 2013-2018 on a separate line. Modify the font size of 2013- 2018 to 10. Position the chart to fill cells J2:S19. Filter the Area chart by removing Others and Windows data so only Android and iOS data displays. If necessary, resize the chart to ensure that it fill cells J2:S19. Mac users, use the Select Data Source dialog box to filter the data. Add a Callout: Line Shape to the Area chart with the line pointing to the top of the orange area between 2014 and 2015. Add text to the callout: Android Market Share Takes Off!. Format the callout with Subtle Effect - Gold, Accent 4 Shape Style. Adjust the size of the as necessary, so that all the text in the callout is visible. Note, depending on the version of Office used, the shape name may be Line Callout 1. Create a 2-D Pie chart using the ranges A15:A21 and G15:G21. Move the chart so it is on its own worksheet. Rename the worksheet Global OS. Modify the chart as follows: Add a title: Operating System 2018 Global Market Share Use Quick Layout 1 to add data % and Series data labels to each data point. On the Data worksheet, create a Clustered Column chart using cells A26:A39 and D26:D39 to show only Android data. Place the chart to fill the range 126:S45. Add a title: 2018 Android Market Share by Country. Add a Column Sparkline to cells H16:H21 using the data in range B16:G21. Increase the width of column H to 15. Create a Filled Map Chart from the data in ranges A26:A39 and D26:D39. Place the chart to fill the range A42:G56. Add a title: 2018 Android Market Share by Country. Save and submit the workbook for aradina. 4 iOS 5 Android 6 Windows 7 Others 8 9 10 11 12 13 14 1 Mobile/Tablet Operating System Market Share 2 3 4 15 16 17 18 19 20 20 21 22 22 23 24 24 25 26 27 2 28 20 29 23 30 30 31 31 32 34 33 35 34 34 35 36 44 37 30 38 39 10 40 41 42 43 201 44 TOU 45 46 47 48 49 50 51 51 52 52 A 62 53 54 55 56 57 58 B United States France UK 2013 52.69% 39.40% 1.15% 6.75% Germany China India India Australia Canada Japan Brazil Egypt South Korea Russia gs.statcounter.com C 2013 86.37% 7.57% 3.57% 1.05% 0.92% 0.53% Global Market share Operating System (desktop/tablet/console) 2014 54.51% 38.03% 1.56% 5.89% 2018 Operating System by Country Windows 36.39% 46.94% 40.88% 43.48% 45.4670 L Statista (www.statista.com/statistics/272700/market-share-held-by-mobile-operating systems-in-the-us-since-2009 20.30% 28.30% 18.70% 18.70% 37.56% 42.64% 41.74% 64.20% 46.96% 40.21% 65.08% 2014 78.35% 7.73% 5.38% 2.97% Windows MacOS iOS Android Linux Other Statista: (www.statista.com/statistics/268237/global-market-share-held-by-operating-systems-since-20091 1.27% 0.64% D ios 28.95% 14.09% 24.96% 24.96% 14.69% 15.98% 2:3070 2.38% 29.43% 26 13% 26.13% 2015 51.38% 45.40% 1.64% 1.57% 27.43% 3.70% 5.24% 15.71% 6.68% 2015 77.01% 0.0822 6.32% 2.78% 1.57% 1.69% E Android 23.08% 0.2598 21.90% 31.60% 51.18% 2016 52.90% 45.05% 1.35% 0.69% 71.17% 18.28% 0175 0.175 11.76% 23.78% 43.54% 39.58% 19.10 % 2016 77.45% 8.24% 5.71% 3.48% 2.74% 1.40% MacOS 8.94% 10.50% 9.39% 7.18% 7.10% O 2.07% 2.07% 1.02% 12.72% 10.98% 15.30% 6.41% 3.04% 2.79% 6.22% F 2017 53.89% 44.97% 0.48% 0.66% 2017 75.67% 10.03% 6.72% 3.36% 1.40% 1.87% Other 1.74% 1.97% 1.62% 2.53% 2.42% 1.20% 1.36% 1.53% 3.54% 1.38% 0.82% 1.67% 2.68% G 2018 54.42% 45.04% 0% 0.54% 2018 75.29% 11.65% 5.64% 3.06% 1.31% 3.05% : H Steps to Perform: Step 1 2 3 4 5 6 7 8 9 10 Start Excel. Open TIA Ch5 Start.xlsx. Instructions Create a 2-D Area chart using the range A3:G7. Add a Chart Title: Change in Mobile OS Market Share 2013-2018. Place 2013-2018 on a separate line. Modify the font size of 2013- 2018 to 10. Position the chart to fill cells J2:S19. Filter the Area chart by removing Others and Windows data so only Android and iOS data displays. If necessary, resize the chart to ensure that it fill cells J2:S19. Mac users, use the Select Data Source dialog box to filter the data. Add a Callout: Line Shape to the Area chart with the line pointing to the top of the orange area between 2014 and 2015. Add text to the callout: Android Market Share Takes Off!. Format the callout with Subtle Effect - Gold, Accent 4 Shape Style. Adjust the size of the as necessary, so that all the text in the callout is visible. Note, depending on the version of Office used, the shape name may be Line Callout 1. Create a 2-D Pie chart using the ranges A15:A21 and G15:G21. Move the chart so it is on its own worksheet. Rename the worksheet Global OS. Modify the chart as follows: Add a title: Operating System 2018 Global Market Share Use Quick Layout 1 to add data % and Series data labels to each data point. On the Data worksheet, create a Clustered Column chart using cells A26:A39 and D26:D39 to show only Android data. Place the chart to fill the range 126:S45. Add a title: 2018 Android Market Share by Country. Add a Column Sparkline to cells H16:H21 using the data in range B16:G21. Increase the width of column H to 15. Create a Filled Map Chart from the data in ranges A26:A39 and D26:D39. Place the chart to fill the range A42:G56. Add a title: 2018 Android Market Share by Country. Save and submit the workbook for aradina. 4 iOS 5 Android 6 Windows 7 Others 8 9 10 11 12 13 14 1 Mobile/Tablet Operating System Market Share 2 3 4 15 16 17 18 19 20 20 21 22 22 23 24 24 25 26 27 2 28 20 29 23 30 30 31 31 32 34 33 35 34 34 35 36 44 37 30 38 39 10 40 41 42 43 201 44 TOU 45 46 47 48 49 50 51 51 52 52 A 62 53 54 55 56 57 58 B United States France UK 2013 52.69% 39.40% 1.15% 6.75% Germany China India India Australia Canada Japan Brazil Egypt South Korea Russia gs.statcounter.com C 2013 86.37% 7.57% 3.57% 1.05% 0.92% 0.53% Global Market share Operating System (desktop/tablet/console) 2014 54.51% 38.03% 1.56% 5.89% 2018 Operating System by Country Windows 36.39% 46.94% 40.88% 43.48% 45.4670 L Statista (www.statista.com/statistics/272700/market-share-held-by-mobile-operating systems-in-the-us-since-2009 20.30% 28.30% 18.70% 18.70% 37.56% 42.64% 41.74% 64.20% 46.96% 40.21% 65.08% 2014 78.35% 7.73% 5.38% 2.97% Windows MacOS iOS Android Linux Other Statista: (www.statista.com/statistics/268237/global-market-share-held-by-operating-systems-since-20091 1.27% 0.64% D ios 28.95% 14.09% 24.96% 24.96% 14.69% 15.98% 2:3070 2.38% 29.43% 26 13% 26.13% 2015 51.38% 45.40% 1.64% 1.57% 27.43% 3.70% 5.24% 15.71% 6.68% 2015 77.01% 0.0822 6.32% 2.78% 1.57% 1.69% E Android 23.08% 0.2598 21.90% 31.60% 51.18% 2016 52.90% 45.05% 1.35% 0.69% 71.17% 18.28% 0175 0.175 11.76% 23.78% 43.54% 39.58% 19.10 % 2016 77.45% 8.24% 5.71% 3.48% 2.74% 1.40% MacOS 8.94% 10.50% 9.39% 7.18% 7.10% O 2.07% 2.07% 1.02% 12.72% 10.98% 15.30% 6.41% 3.04% 2.79% 6.22% F 2017 53.89% 44.97% 0.48% 0.66% 2017 75.67% 10.03% 6.72% 3.36% 1.40% 1.87% Other 1.74% 1.97% 1.62% 2.53% 2.42% 1.20% 1.36% 1.53% 3.54% 1.38% 0.82% 1.67% 2.68% G 2018 54.42% 45.04% 0% 0.54% 2018 75.29% 11.65% 5.64% 3.06% 1.31% 3.05% : H


