Answered step by step
Verified Expert Solution
Question
1 Approved Answer
Please help with this. It is using R studio. 1. Shrub Volume Data Basics (20 pts) Dr. Granger is interested in studying the factors controlling
Please help with this. It is using R studio. 
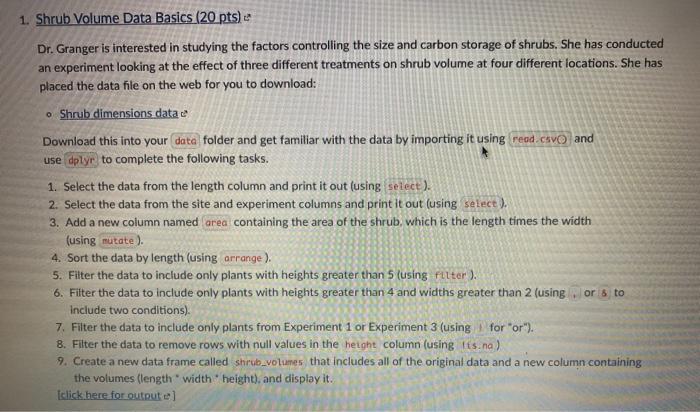
1. Shrub Volume Data Basics (20 pts) Dr. Granger is interested in studying the factors controlling the size and carbon storage of shrubs. She has conducted an experiment looking at the effect of three different treatments on shrub volume at four different locations. She has placed the data file on the web for you to download: Shrub dimensions data e Download this into your data folder and get familiar with the data by importing it using read.csvo and use dply to complete the following tasks. 1. Select the data from the length column and print it out (using select). 2. Select the data from the site and experiment columns and print it out (using select). 3. Add a new column named area containing the area of the shrub, which is the length times the width (using mutate). 4. Sort the data by length (using arrange). 5. Filter the data to include only plants with heights greater than 5 (using filter). 6. Filter the data to include only plants with heights greater than 4 and widths greater than 2 (using or 8 to include two conditions) 7. Filter the data to include only plants from Experiment 1 or Experiment 3 (using for or"). 8. Filter the data to remove rows with null values in the height column (using its.na) 9. Create a new data frame called shrub_volumes that includes all of the original data and a new column containing the volumes (length*width" height), and display it. Iclick here for output el 1. Shrub Volume Data Basics (20 pts) Dr. Granger is interested in studying the factors controlling the size and carbon storage of shrubs. She has conducted an experiment looking at the effect of three different treatments on shrub volume at four different locations. She has placed the data file on the web for you to download: Shrub dimensions data e Download this into your data folder and get familiar with the data by importing it using read.csvo and use dply to complete the following tasks. 1. Select the data from the length column and print it out (using select). 2. Select the data from the site and experiment columns and print it out (using select). 3. Add a new column named area containing the area of the shrub, which is the length times the width (using mutate). 4. Sort the data by length (using arrange). 5. Filter the data to include only plants with heights greater than 5 (using filter). 6. Filter the data to include only plants with heights greater than 4 and widths greater than 2 (using or 8 to include two conditions) 7. Filter the data to include only plants from Experiment 1 or Experiment 3 (using for or"). 8. Filter the data to remove rows with null values in the height column (using its.na) 9. Create a new data frame called shrub_volumes that includes all of the original data and a new column containing the volumes (length*width" height), and display it. Iclick here for output el 
Step by Step Solution
There are 3 Steps involved in it
Step: 1

Get Instant Access to Expert-Tailored Solutions
See step-by-step solutions with expert insights and AI powered tools for academic success
Step: 2

Step: 3

Ace Your Homework with AI
Get the answers you need in no time with our AI-driven, step-by-step assistance
Get Started


