Answered step by step
Verified Expert Solution
Link Copied!

Question

1 Approved Answer

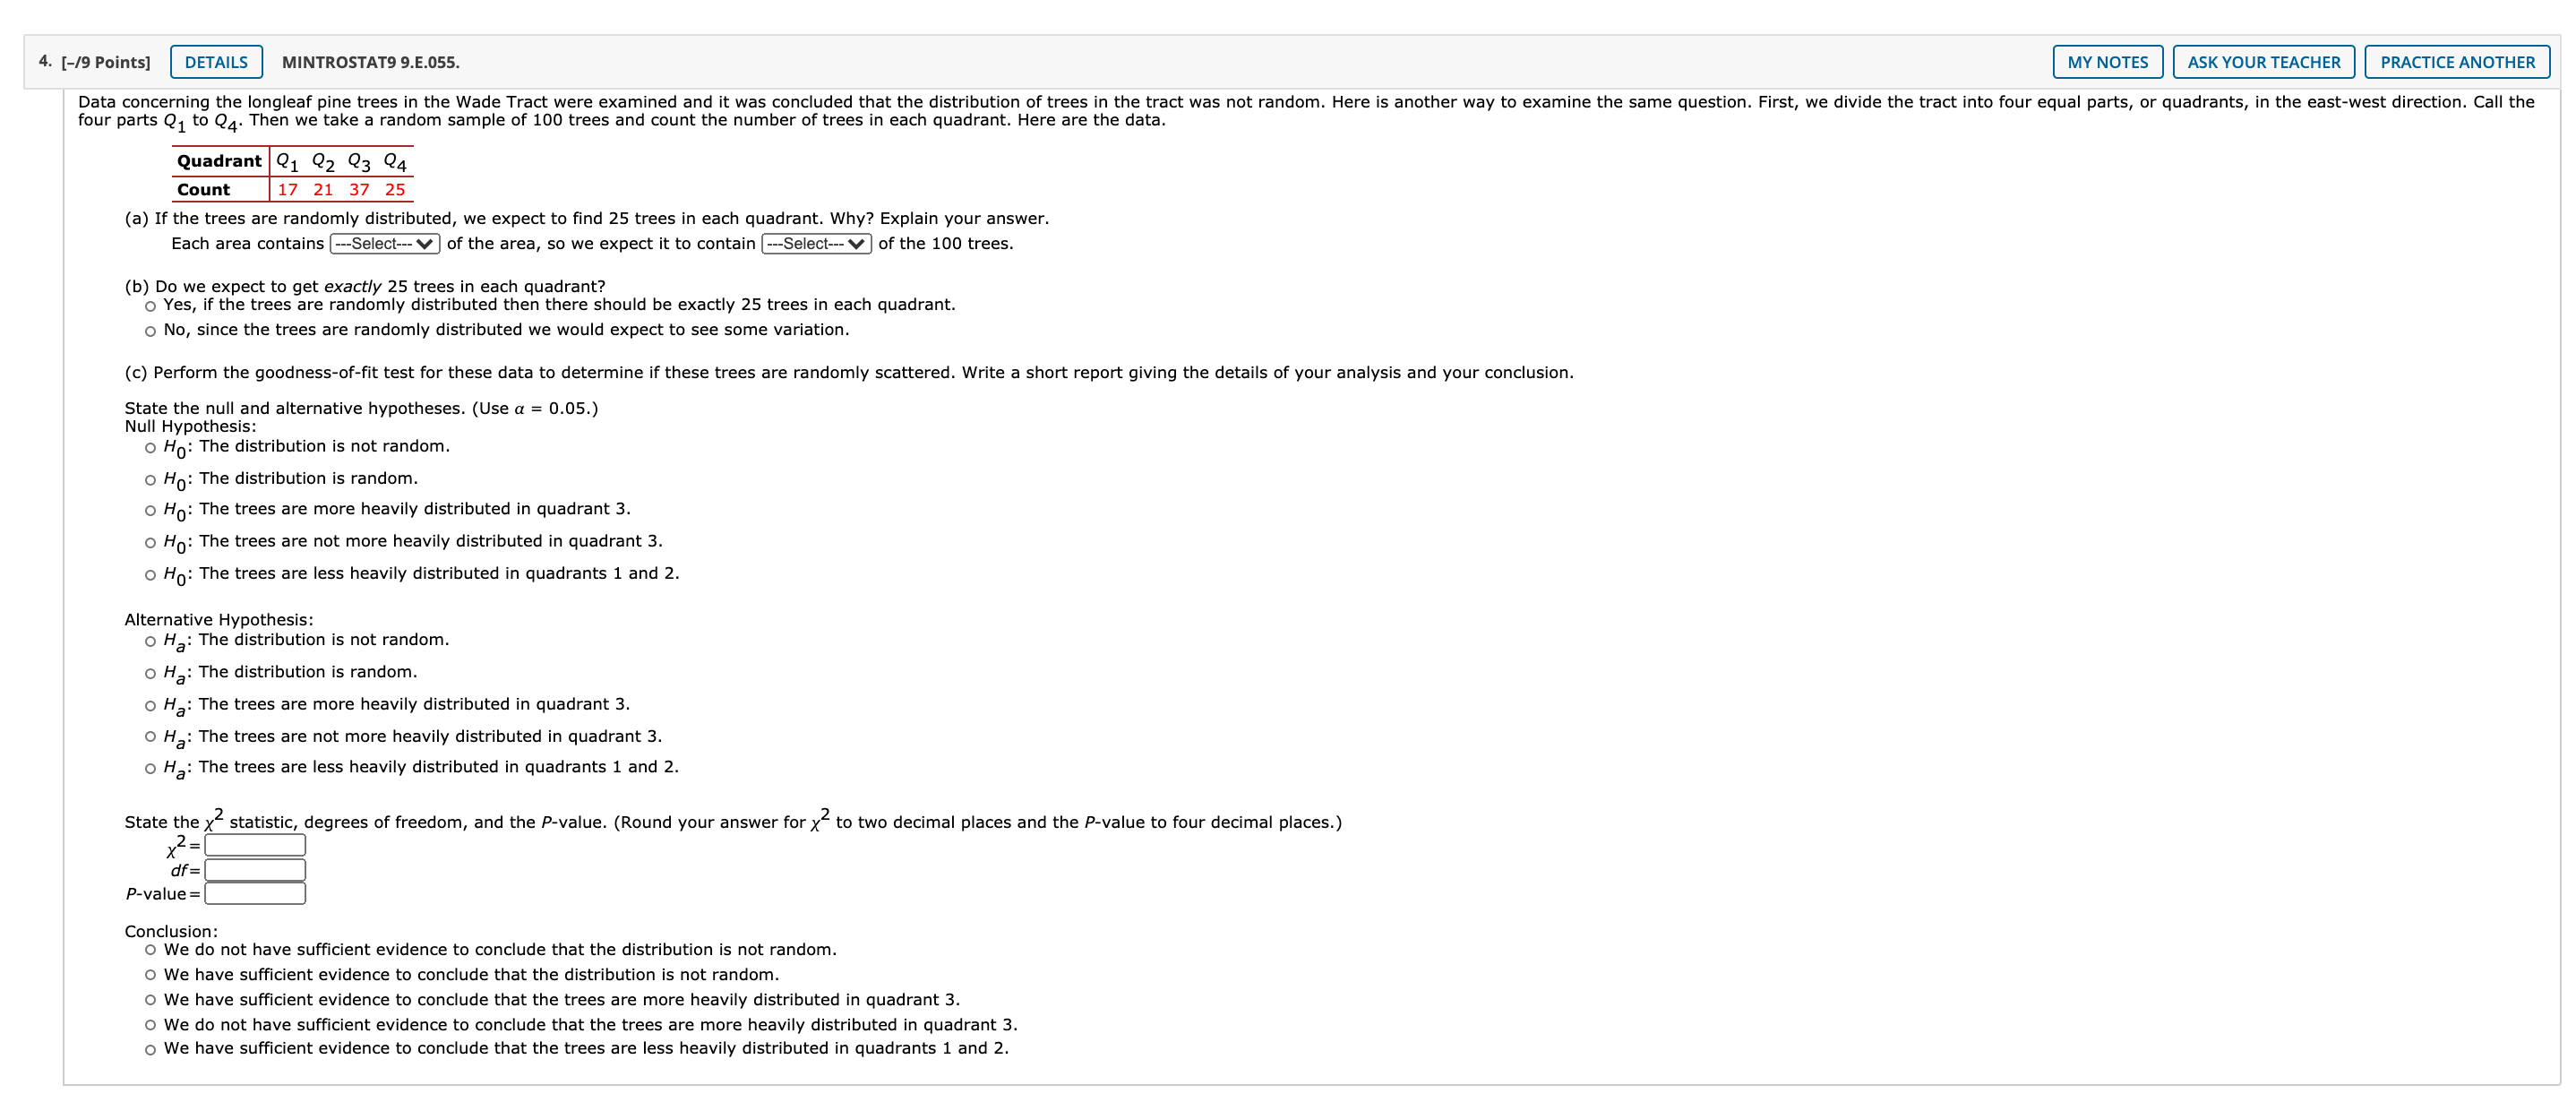
please help with this question and show work 4. [-/9 Points] DETAILS MINTROSTAT9 9.E.055. MY NOTES ASK YOUR TEACHER PRACTICE ANOTHER Data concerning the longleaf

please help with this question and show work

image text in transcribed
4. [-/9 Points] DETAILS MINTROSTAT9 9.E.055. MY NOTES ASK YOUR TEACHER PRACTICE ANOTHER Data concerning the longleaf pine trees in the Wade Tract were examined and it was concluded that the distribution of trees in the tract was not random. Here is another way to examine the same question. First, we divide the tract into four equal parts, or quadrants, in the east-west direction. Call the four parts Q, to Q4. Then we take a random sample of 100 trees and count the number of trees in each quadrant. Here are the data. Quadrant |21 22 23 24 Count 17 21 37 25 (a) If the trees are randomly distributed, we expect to find 25 trees in each quadrant. Why? Explain your answer. Each area contains [---Select--- V ) of the area, so we expect it to contain [---Select--- V ] of the 100 trees. (b) Do we expect to get exactly 25 trees in each quadrant? o Yes, if the trees are randomly distributed then there should be exactly 25 trees in each quadrant. No, since the trees are randomly distributed we would expect to see some variation. (c) Perform the goodness-of-fit test for these data to determine if these trees are randomly scattered. Write a short report giving the details of your analysis and your conclusion. State the null and alternative hypotheses. (Use a = 0.05.) Null Hypothesis: O Ho: The distribution is not random. O Ho: The distribution is random. o Ho: The trees are more heavily distributed in quadrant 3. o Ho: The trees are not more heavily distributed in quadrant 3. o Ho: The trees are less heavily distributed in quadrants 1 and 2. Alternative Hypothesis: O Ha: The distribution is not random. O Ha: The distribution is random. O Ha: The trees are more heavily distributed in quadrant 3. O Ha: The trees are not more heavily distributed in quadrant 3. O Ha: The trees are less heavily distributed in quadrants 1 and 2. State the y statistic, degrees of freedom, and the P-value. (Round your answer for x" to two decimal places and the P-value to four decimal places.) 2= df = P-value = Conclusion: O We do not have sufficient evidence to conclude that the distribution is not random. We have sufficient evidence to conclude that the distribution is not random. We have sufficient evidence to conclude that the trees are more heavily distributed in quadrant 3. We do not have sufficient evidence to conclude that the trees are more heavily distributed in quadrant 3. We have sufficient evidence to conclude that the trees are less heavily distributed in quadrants 1 and 2

Step by Step Solution

There are 3 Steps involved in it

Step: 1

blur-text-image

Get Instant Access to Expert-Tailored Solutions

See step-by-step solutions with expert insights and AI powered tools for academic success

Step: 2

blur-text-image

Step: 3

blur-text-image

Ace Your Homework with AI

Get the answers you need in no time with our AI-driven, step-by-step assistance

Get Started

Recommended Textbook for

Mathematical Applications For The Management, Life And Social Sciences

Authors: Ronald J. Harshbarger, James J. Reynolds

12th Edition

978-1337625340

More Books

Students also viewed these Mathematics questions