Please help with this question, thank you!!!
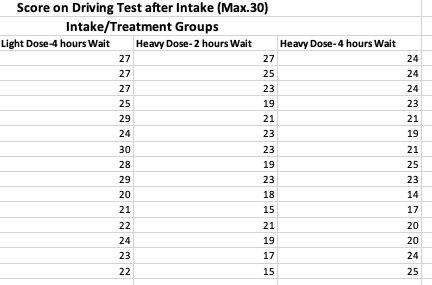
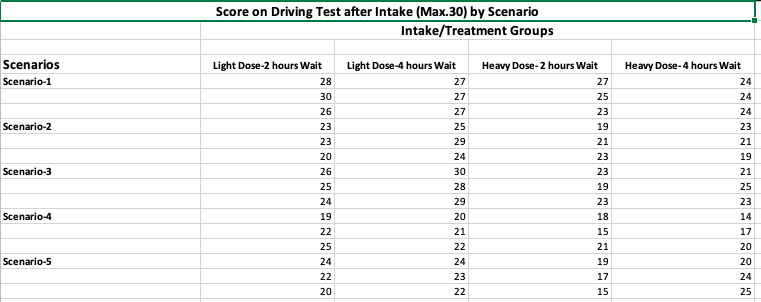
Score on Driving Test after Intake (Max.30) Intake/Treatment Groups Light Dose-4 hours Wait Heavy Dose-2 hours Wait Heavy Dose- 4 hours Wait 27 27 24 27 25 24 27 23 24 25 19 23 29 21 21 24 23 19 30 23 21 28 19 25 29 23 23 20 18 14 21 15 17 22 21 20 24 19 20 23 17 24 22 15 25Score on Driving Test after Intake (Max.30) by Scenario Intake/Treatment Groups Scenarios Light Dose-2 hours Wait Light Dose-4 hours Wait Heavy Dose-2 hours Wait Heavy Dose-4 hours Wait Scenario-1 28 27 27 24 30 27 25 24 26 27 23 24 Scenario-2 23 25 19 23 23 29 21 21 20 24 23 19 Scenario-3 26 30 23 21 25 28 19 25 24 29 23 23 Scenario-4 19 20 18 14 22 21 15 17 25 22 21 20 Scenario-5 24 24 19 20 22 23 17 24 20 22 15 25Further to the legalization of Cannabis in Canada, the Ontario Ministry of Transportation (OMT) is preparing an advertising campaign to discourage impaired driving due to the use of cannabis products. The campaign will target the most dangerous combinations of THC levels and time since last intake on driving competencies. As a recent Telfer graduate with a passion for statistics, you've been hired by the OMT to manage this project with the assistance of a research agency. You recruit 60 individuals and assign them randomly to 4 different treatment groups of interest. Subjects must consume a certain quantity of cannabis and then go to a virtual simulator room after a certain period of time to test their driving abilities on a scale totaling 30 points. Score data for the different treatment groups can be found in the Assign3Data.xlsx file.f) [6 marks] Using the one-way ANOVA in e) above, test if there is a significant difference in the true mean score between the 4 treatment groups using the critical value approach and a 5% significance level. Make sure you follow all the steps for hypothesis testing indicated in the Instructions section, show your computations, and state the business significance of your conclusion. g) [2 marks] Use the Bonferroni multiple comparison method to determine which population means differ at a = 0.05. Show your computations. h) [3 marks] Perform a Kruskal-Wallis non-parametric test to determine whether there is a difference among the four-intake group (treatment group) scores. Use a 5% significance level and the critical value approach. You can use Excel or Minitab for your calculations but remember to show all the steps of your hypothesis test. Is your conclusion consistent with your results in f) above?Question 2 (7 parts, 25 marks) Following your initial analysis in Question 1 above, you think that, in addition to cannabis use, road conditions may also affect driving abilities and contribute to an increased risk of road accidents. You suggest that further testing be made using 5 different road-condition scenarios in the virtual driving simulator. Your proposal is accepted and a new group of 60 individuals are solicited to participate in the study and are randomly assigned to one of the various treatment groups. Score data for the different treatment groups can be found in the Assign3Data.xIsx file. a) [4 marks] Identify the experimental design and determine the number of treatments, experimental units and replicates. b) [5 marks] Plot the residuals against the fitted values corresponding to the two-way ANOVA model for this experiment. What two key model assumptions can be examined with this plot and do they appear to be warranted?c) [6 marks] Test the following hypothesis at the 1% significance level; make sure you follow all the steps for hypothesis testing indicated in the Instructions section and show your computations. i. Significant interaction effect between cannabis intake and road conditions; ii. Significant main effect of the cannabis intake factor (if warranted); iii. Significant main effect of the road conditions factor (if warranted). d) [2 marks] Examine the interaction plot and explain if it shows interaction between cannabis intake and road conditions impacting on driving scores; is this consistent with the results in c) above? e) [2 marks] Which combinations of cannabis intake and road conditions (treatment means) have the lowest and highest average driving scores? f) [4 marks] Why is it appropriate to use the Bonferroni method for comparing treatment means? Calculate the Bonferroni margin of error for the confidence intervals based on all pairwise differences between the treatment means. Show your manual calculations and use an overall 95% confidence level. g) [2 marks] Using the calculated margin of error and the pairwise confidence interval approach in e) above, test the following statements: i. Under normal summer road conditions, does light vs. heavy cannabis intake makes a significant difference on driving abilities if you wait 4 hours before driving? ii. After a heavy intake of cannabis, does ice rain vs normal summer road conditions makes a significant difference on driving abilities if you wait 4 hours before driving