please help!JMP USE
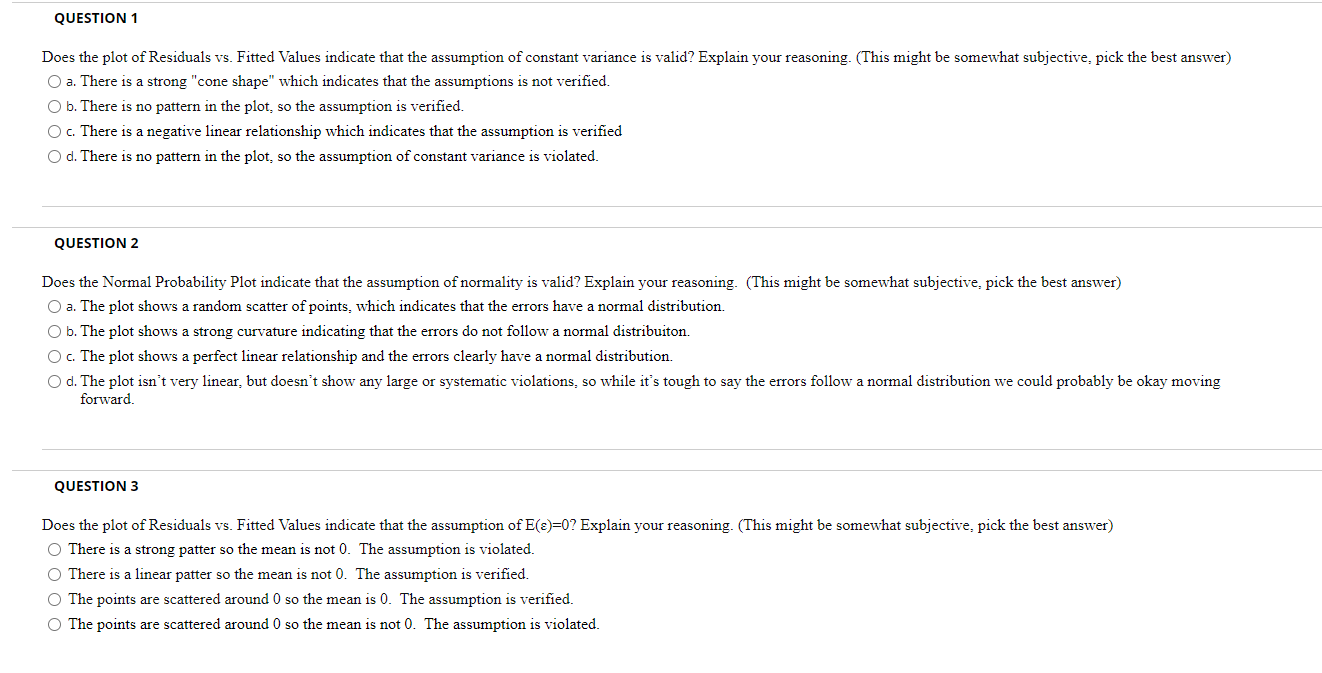
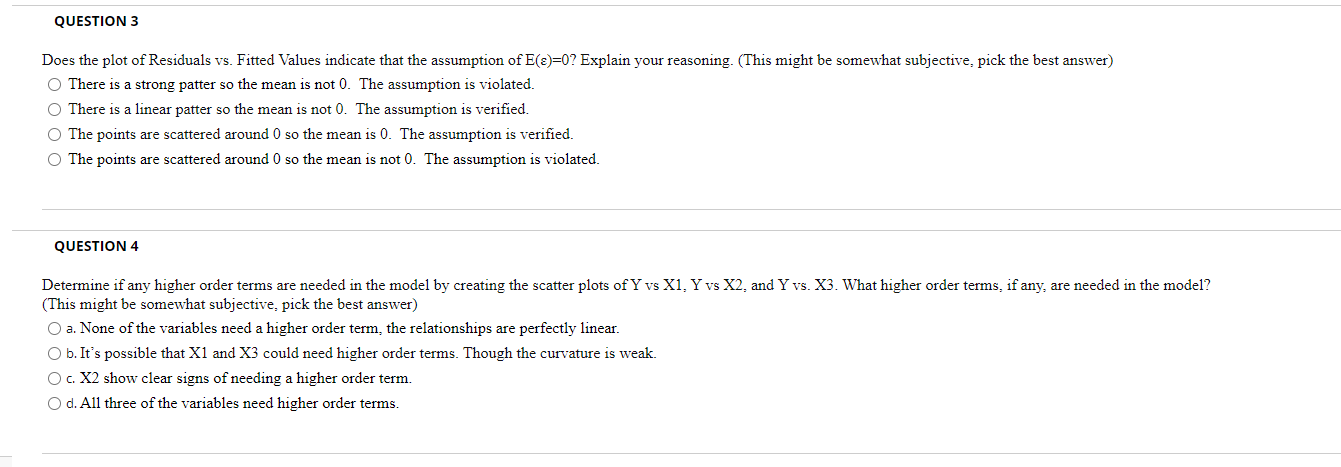
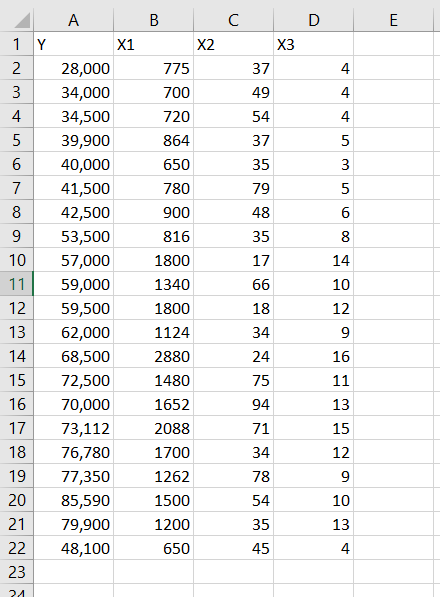
QUESTION 1 Does the plot of Residuals vs. Fitted Values indicate that the assumption of constant variance is valid? Explain your reasoning. (This might be somewhat subjective, pick the best answer) O a. There is a strong "cone shape" which indicates that the assumptions is not verified. O b. There is no pattern in the plot, so the assumption is verified. O c. There is a negative linear relationship which indicates that the assumption is verified O d. There is no pattern in the plot, so the assumption of constant variance is violated. QUESTION 2 Does the Normal Probability Plot indicate that the assumption of normality is valid? Explain your reasoning. (This might be somewhat subjective, pick the best answer) O a. The plot shows a random scatter of points, which indicates that the errors have a normal distribution. O b. The plot shows a strong curvature indicating that the errors do not follow a normal distribuiton. O c. The plot shows a perfect linear relationship and the errors clearly have a normal distribution. O d. The plot isn't very linear, but doesn't show any large or systematic violations, so while it's tough to say the errors follow a normal distribution we could probably be okay moving forward. QUESTION 3 Does the plot of Residuals vs. Fitted Values indicate that the assumption of E(=)=0? Explain your reasoning. (This might be somewhat subjective, pick the best answer) O There is a strong patter so the mean is not 0. The assumption is violated. O There is a linear patter so the mean is not 0. The assumption is verified. O The points are scattered around 0 so the mean is 0. The assumption is verified. O The points are scattered around 0 so the mean is not 0. The assumption is violated.JESTION 3 Does the plot of Residuals vs. Fitted Values indicate that the assumption of E()=0? Explain your reasoning. (This might be somewhat subjective, pick the best answer) O There is a strong patter so the mean is not 0. The assumption is violated. O There is a linear patter so the mean is not 0. The assumption is verified. O The points are scattered around 0 so the mean is 0. The assumption is verified. O The points are scattered around 0 so the mean is not 0. The assumption is violated. QUESTION 4 Determine if any higher order terms are needed in the model by creating the scatter plots of Y vs X1, Y vs X2, and Y vs. X3. What higher order terms, if any, are needed in the model? (This might be somewhat subjective, pick the best answer) O a. None of the variables need a higher order term, the relationships are perfectly linear. O b. It's possible that X1 and X3 could need higher order terms. Though the curvature is weak. O c. X2 show clear signs of needing a higher order term. O d. All three of the variables need higher order terms.\f


