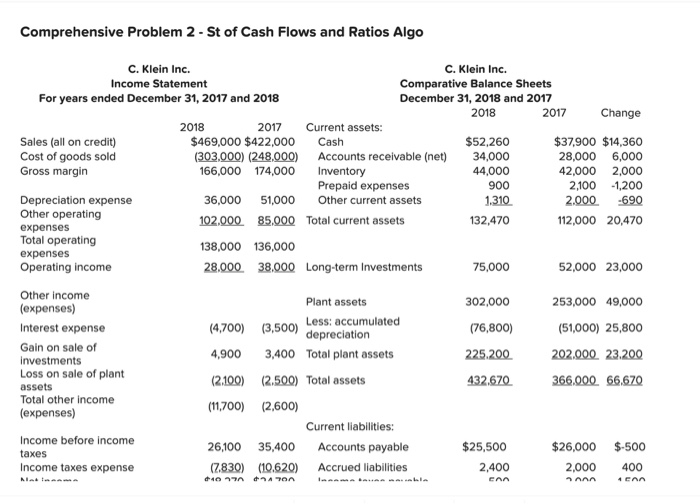
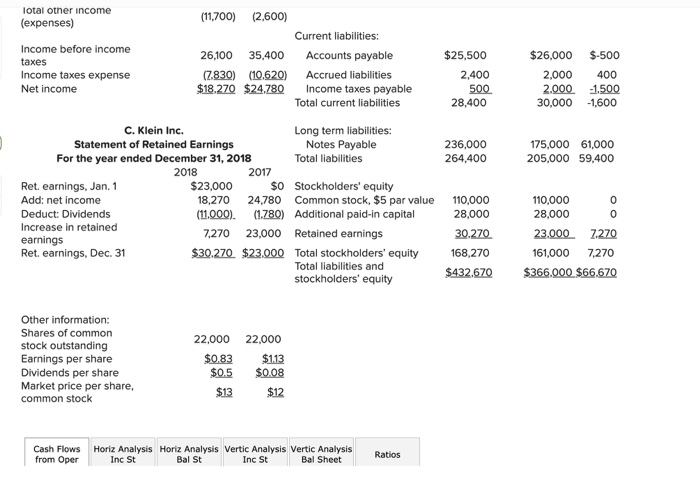
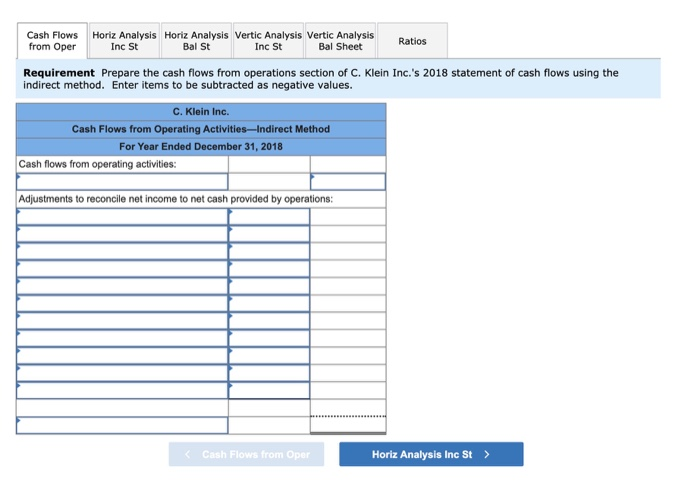
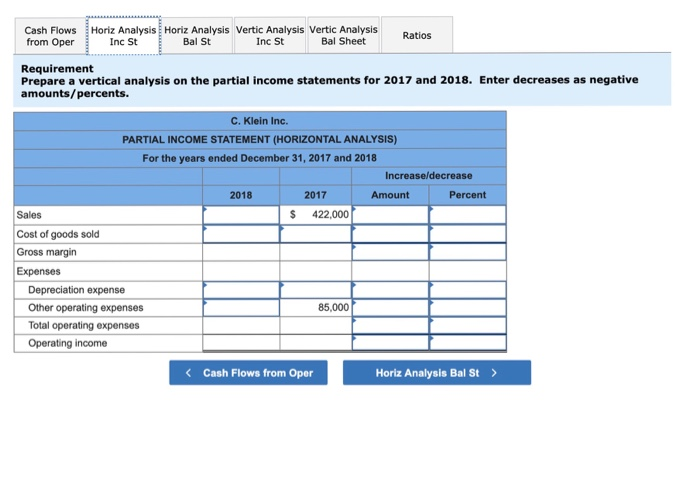
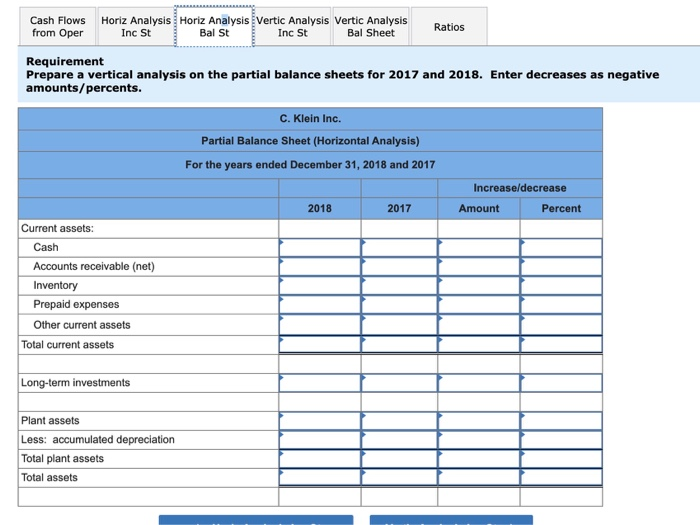
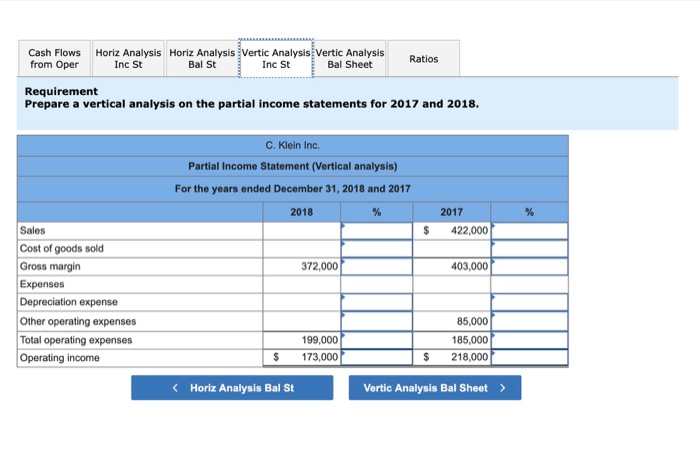
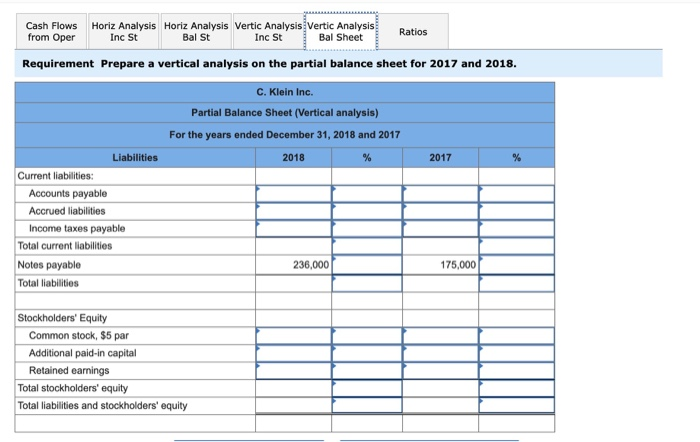
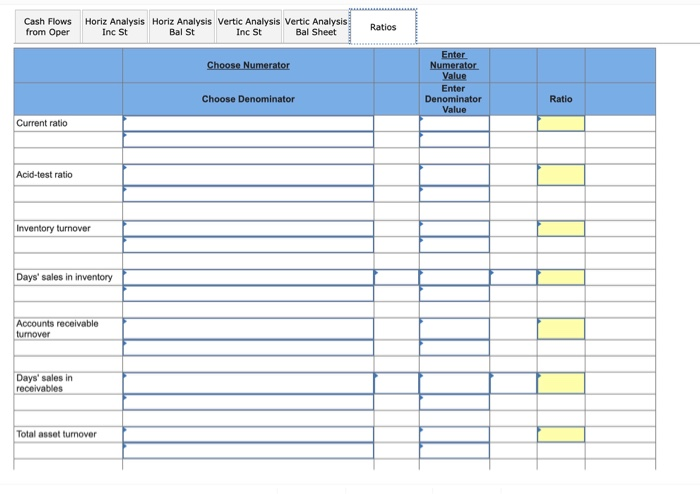
Comprehensive Problem 2 - St of Cash Flows and Ratios Algo C. Klein Inc. C. Klein Inc. Income Statement Comparative Balance Sheets For years ended December 31, 2017 and 2018 December 31, 2018 and 2017 2018 2017 Change 2018 2017 Current assets: Sales (all on credit) $469,000 $422,000 Cash $52,260 $37,900 $14,360 Cost of goods sold (303,000) (248,000) Accounts receivable (net) 34,000 28,000 6,000 Gross margin 166,000 174,000 Inventory 44,000 42,000 2,000 Prepaid expenses 900 2,100 -1,200 Depreciation expense 36,000 51,000 Other current assets 1.310 2.000 -690 Other operating 102,000 85,000 Total current assets 132,470 112,000 20,470 expenses Total operating expenses 138,000 136,000 Operating income 28.000 38,000 Long-term Investments 75,000 52,000 23,000 Other Income (expenses) Plant assets 302,000 253,000 49,000 Interest expense Less: accumulated (4,700) (3,500) depreciation (76,800) (51,000) 25,800 Gain on sale of 4,900 investments 3,400 Total plant assets 225.200 202.000 23.200 Loss on sale of plant (2.100) (2.500) Total assets 432.670 366.000 66,670 assets Total other income (expenses) (11,700) (2.600) Current liabilities: Income before income 26,100 35,400 Accounts payable $25,500 $26.000 $-500 taxes Income taxes expense (7.830) (10.620) Accrued liabilities 2,400 2,000 400 ANA An CAN $25,500 2,400 500 28,400 $26.000 $-500 2,000 400 2.000 1.500 30,000 -1,600 Total other income (expenses) (11,700) (2.600) Current liabilities: Income before income 26,100 35,400 Accounts payable taxes Income taxes expense (7.830) (10.620) Accrued liabilities Net Income $18.270 $24.780 Income taxes payable Total current liabilities C. Klein Inc. Long term liabilities: Statement of Retained Earnings Notes Payable For the year ended December 31, 2018 Total liabilities 2018 2017 Ret. earnings, Jan. 1 $23,000 $0 Stockholders' equity Add: net income 18,270 24,780 Common stock, $5 par value Deduct: Dividends (11.000). (1.780) Additional paid-in capital Increase in retained 7,270 23,000 Retained earnings earnings Ret, earnings, Dec. 31 $30.270 $23.000 Total stockholders' equity Total liabilities and stockholders' equity 236,000 264,400 175,000 61,000 205,000 59,400 110,000 28,000 30.270 168,270 $432.670 110,000 28,000 0 23.000 7.270 161,000 7,270 $366.000 $66.670 Other information: Shares of common stock outstanding Earnings per share Dividends per share Market price per share, common stock 22,000 22.000 $0.83 $1.13 $0.5 $0.08 $13 $12 Cash Flows from Oper Horiz Analysis Horiz Analysis Vertic Analysis Vertic Analysis Inc St Bal St Inc St Bal Sheet Ratios Cash Flows from Oper Horiz Analysis Horiz Analysis Vertic Analysis Vertic Analysis Inc St Bal St Inc St Bal Sheet Ratios Requirement Prepare the cash flows from operations section of C. Klein Inc.'s 2018 statement of cash flows using the indirect method. Enter items to be subtracted as negative values. C. Klein Inc. Cash Flows from Operating ActivitiesIndirect Method For Year Ended December 31, 2018 Cash flows from operating activities: Adjustments to reconcile net income to net cash provided by operations: Cash Flows from Oper Horiz Analysis Inc St > Cash Flows from Oper Horiz Analysis Horiz Analysis Vertic Analysis Vertic Analysis Inc St Bal St Inc St Bal Sheet Ratios Requirement Prepare a vertical analysis on the partial income statements for 2017 and 2018. Enter decreases as negative amounts/percents. $ C. Klein Inc. PARTIAL INCOME STATEMENT (HORIZONTAL ANALYSIS) For the years ended December 31, 2017 and 2018 Increase/decrease 2018 2017 Amount Percent Sales 422,000 Cost of goods sold Gross margin Expenses Depreciation expense Other operating expenses 85,000 Total operating expenses Operating income Ratios Cash Flows Horiz Analysis Horiz Analysis Vertic Analysis Vertic Analysis from Oper Inc St Bal St Inc St Bal Sheet Requirement Prepare a vertical analysis on the partial balance sheets for 2017 and 2018. Enter decreases as negative amounts/percents. C. Klein Inc. Partial Balance Sheet (Horizontal Analysis) For the years ended December 31, 2018 and 2017 2018 Increase/decrease Amount Percent 2017 Current assets: Cash Accounts receivable (net) Inventory Prepaid expenses Other current assets Total current assets Long-term investments Plant assets Less: accumulated depreciation Total plant assets Total assets Ratios Cash Flows Horiz Analysis Horiz Analysis Vertic Analysis Vertic Analysis from Oper Inc St Bal St Inc St Bal Sheet Requirement Prepare a vertical analysis on the partial income statements for 2017 and 2018. C. Klein Inc. Partial Income Statement (Vertical analysis) For the years ended December 31, 2018 and 2017 2018 % % 2017 422,000 $ 372,000 403,000 Sales Cost of goods sold Gross margin Expenses Depreciation expense Other operating expenses Total operating expenses Operating income 199,000 173,000 85,000 185,000 218,000 $ $ Ratios from Oper Bal St Inc St Bal Sheet Cash Flows Horiz Analysis Horiz Analysis Vertic Analysis Vertic Analysis Inc St Requirement Prepare a vertical analysis on the partial balance sheet for 2017 and 2018. C. Klein Inc. Partial Balance Sheet (Vertical analysis) For the years ended December 31, 2018 and 2017 2018 % 2017 Liabilities Current liabilities: Accounts payable Accrued liabilities Income taxes payable Total current liabilities Notes payable Total liabilities 236,000 175,000 Stockholders' Equity Common stock, $5 par Additional paid-in capital Retained earnings Total stockholders' equity Total liabilities and stockholders' equity Cash Flows Horiz Analysis Horiz Analysis Vertic Analysis Vertic Analysis from Oper Inc St Bal St Inc St Bal Sheet Ratios Choose Numerator Enter Numerator Value Enter Denominator Value Choose Denominator Ratio Current ratio Acid-test ratio Inventory turnover Days' sales in inventory Accounts receivable turnover Days' sales in receivables Total asset turnover Days' sales in receivables Total asset turnover Debt-to-equity ratio Profit margin Return on total assets Return on common stockholders' equity Pricelearnings ratio (P/E) Dividend yield