Please I need a better explanation to add to my understanding to this questions
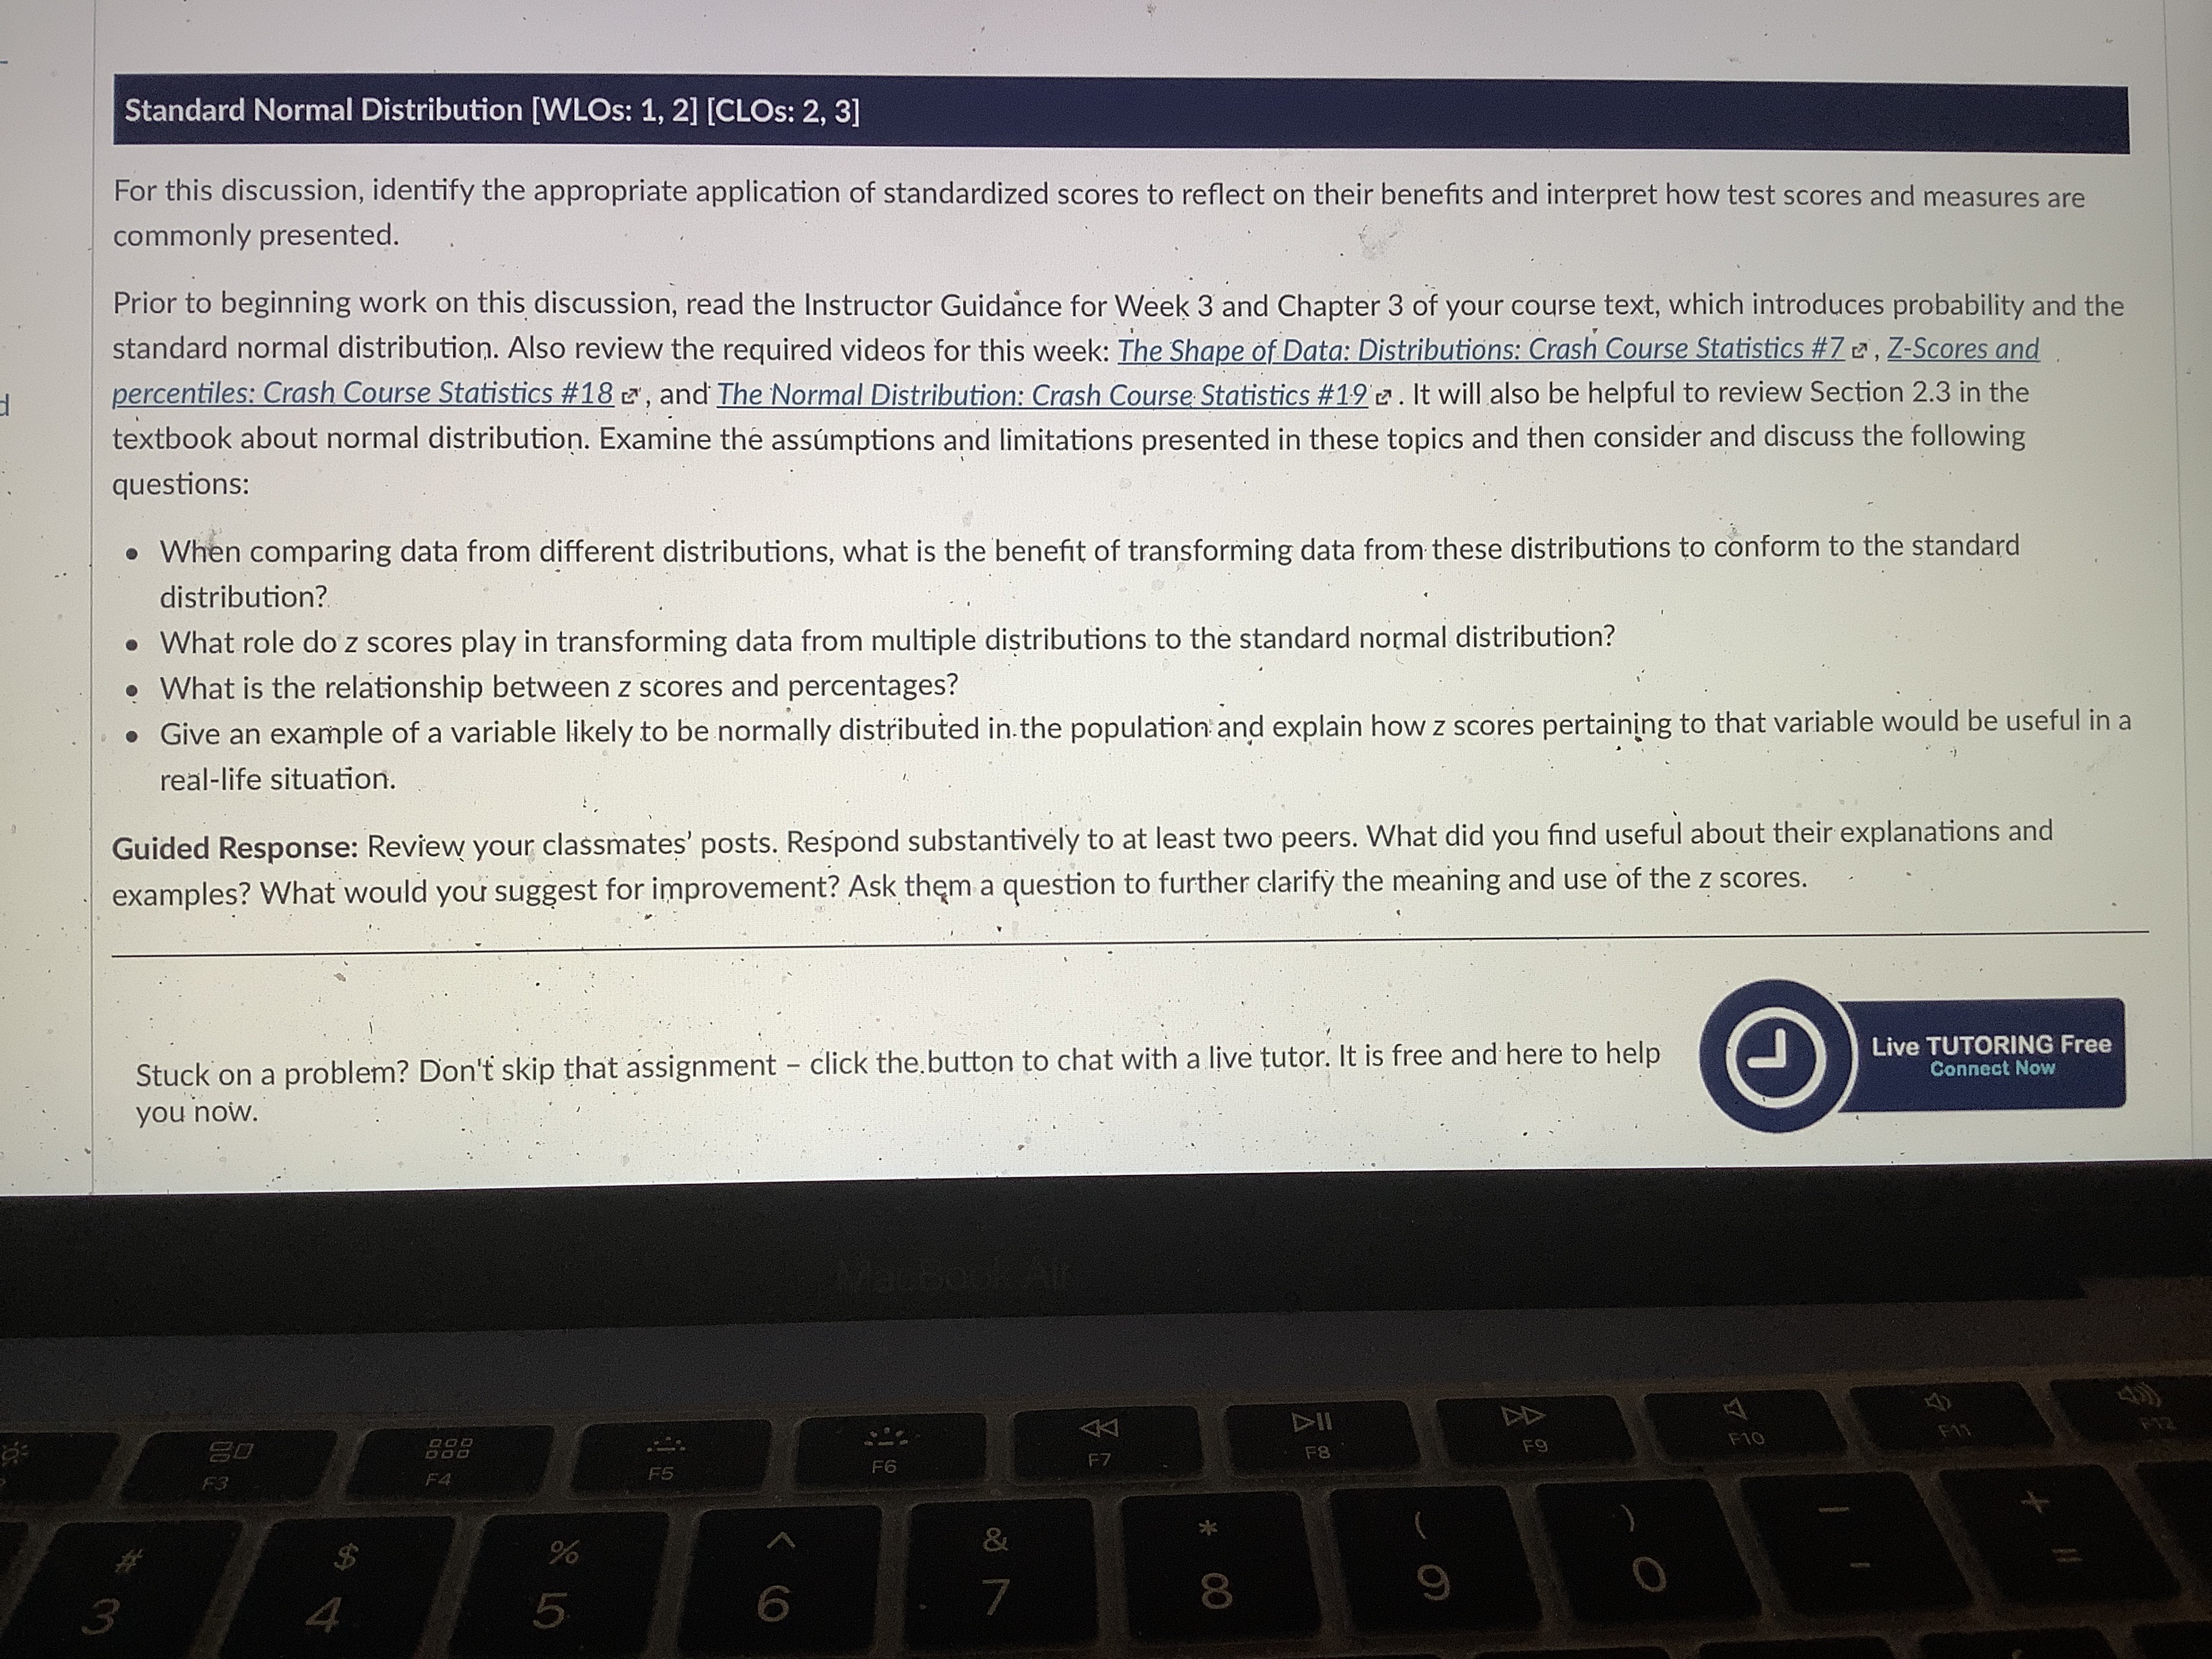
Standard Normal Distribution [WLOs: 1, 2] [CLOs: 2, 3] For this discussion, identify the appropriate application of standardized scores to reflect on their benefits and interpret how test scores and measures are commonly presented. Prior to beginning work on this discussion, read the Instructor Guidance for Week 3 and Chapter 3 of your course text, which introduces probability and the standard normal distribution. Also review the required videos for this week: The Shape of Data: Distributions: Crash Course Statistics # 7 , Z-Scores and percentiles: Crash Course Statistics #18 , and The Normal Distribution: Crash Course Statistics #12 2 . It will also be helpful to review Section 2.3 in the textbook about normal distribution. Examine the assumptions and limitations presented in these topics and then consider and discuss the following questions: When comparing data from different distributions, what is the benefit of transforming data from these distributions to conform to the standard distribution? What role do z scores play in transforming data from multiple distributions to the standard normal distribution? . What is the relationship between z scores and percentages? . Give an example of a variable likely to be normally distributed in the population and explain how z scores pertaining to that variable would be useful in a real-life situation. Guided Response: Review your classmates' posts. Respond substantively to at least two peers. What did you find useful about their explanations and examples? What would you suggest for improvement? Ask them a question to further clarify the meaning and use of the z scores. Stuck on a problem? Don't skip that assignment - click the. button to chat with a live tutor. It is free and here to help Live TUTORING Free Connect Now you now. A 44 588 F8 F9 F10 F4 F5 F6 F7 F3 % 9 3