Answered step by step
Verified Expert Solution
Link Copied!

Question

1 Approved Answer

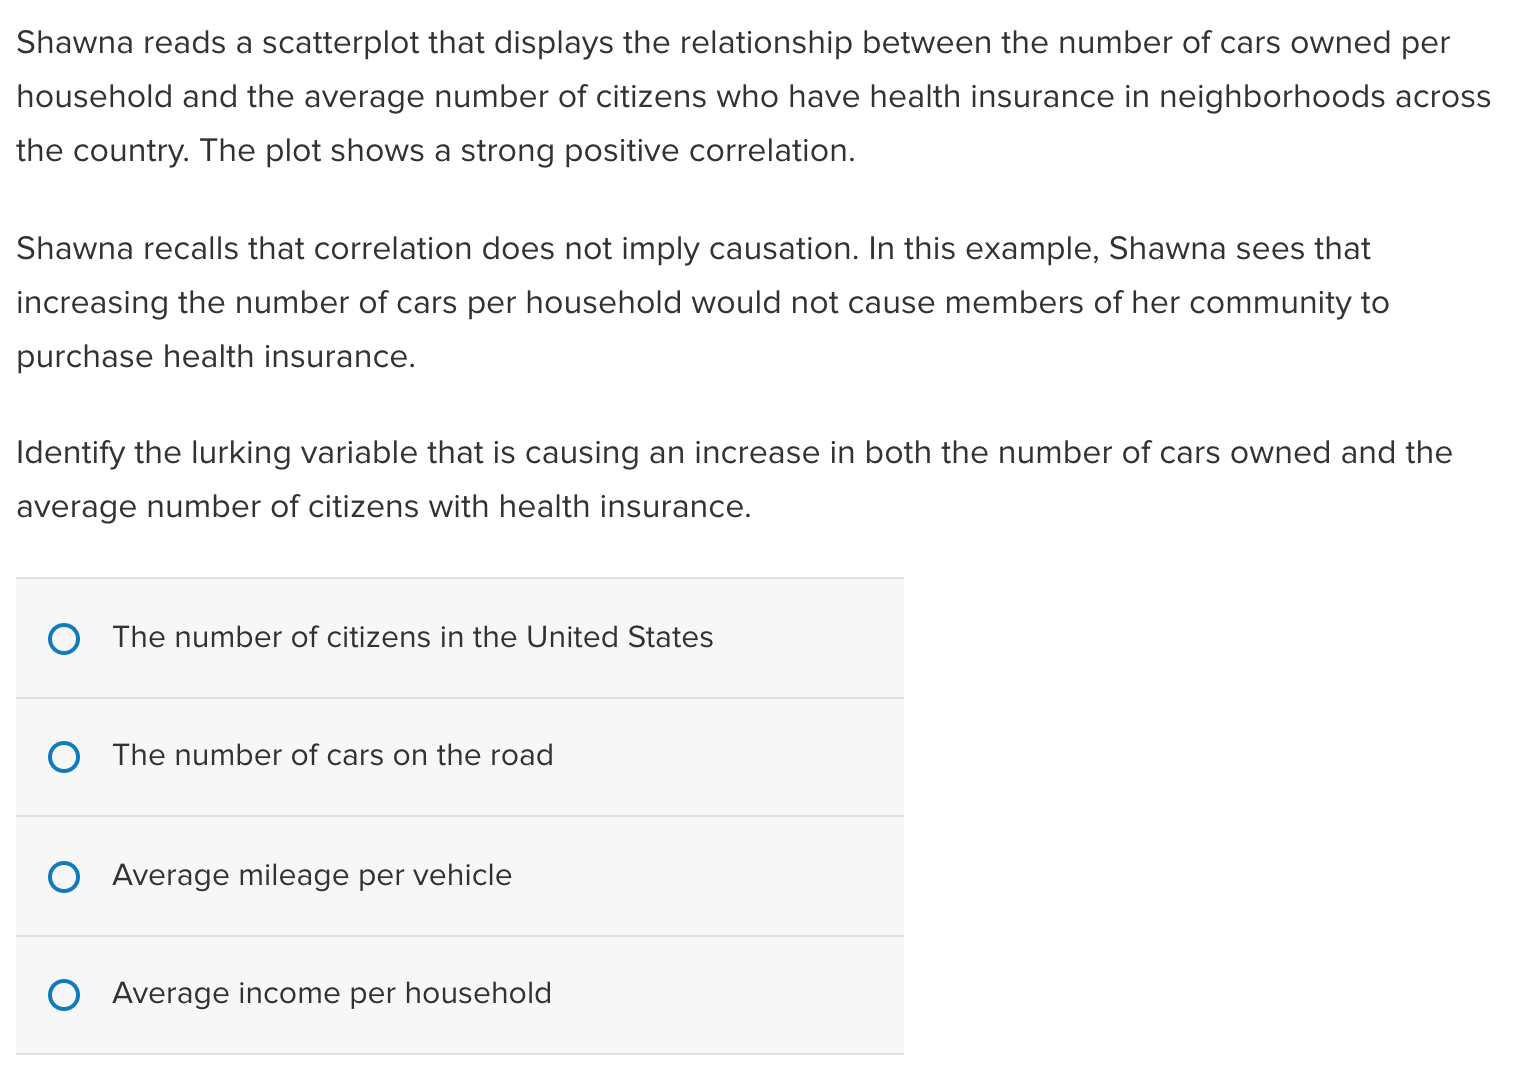
Please I need an answer to this question: Thanks a lot. Shawna reads a scatterplot that displays the relationship between the number of cars owned

Please I need an answer to this question:

Thanks a lot.

image text in transcribed
Shawna reads a scatterplot that displays the relationship between the number of cars owned per household and the average number of citizens who have health insurance in neighborhoods across the country. The plot shows a strong positive correlation. Shawna recalls that correlation does not imply causation. In this example, Shawna sees that increasing the number of cars per household would not cause members of her community to purchase health insurance. Identify the lurking variable that is causing an increase in both the number of cars owned and the average number of citizens with health insurance. 0 The number of citizens in the United States 0 The number of cars on the road 0 Average mileage per vehicle 0 Average income per household

Step by Step Solution

There are 3 Steps involved in it

Step: 1

blur-text-image

Get Instant Access to Expert-Tailored Solutions

See step-by-step solutions with expert insights and AI powered tools for academic success

Step: 2

blur-text-image

Step: 3

blur-text-image

Ace Your Homework with AI

Get the answers you need in no time with our AI-driven, step-by-step assistance

Get Started

Recommended Textbook for

Mathematics Concepts With Applications

Authors: Charles P McKeague

1st Edition

1630983136, 9781630983130

More Books

Students also viewed these Mathematics questions

Question

Tag that specifies the character encoding used in the document.

Answered: 1 week ago

Question

1. Understand that measurement is a process.

Answered: 1 week ago