

Answered step by step
Verified Expert Solution
Question
1 Approved Answer
please i need help in excel by writing the formula to understand thank you e Search AutoSave ODE 8 File Home Insert 8 Draw Nasser_Berk
please i need help in excel by writing the formula to understand thank you
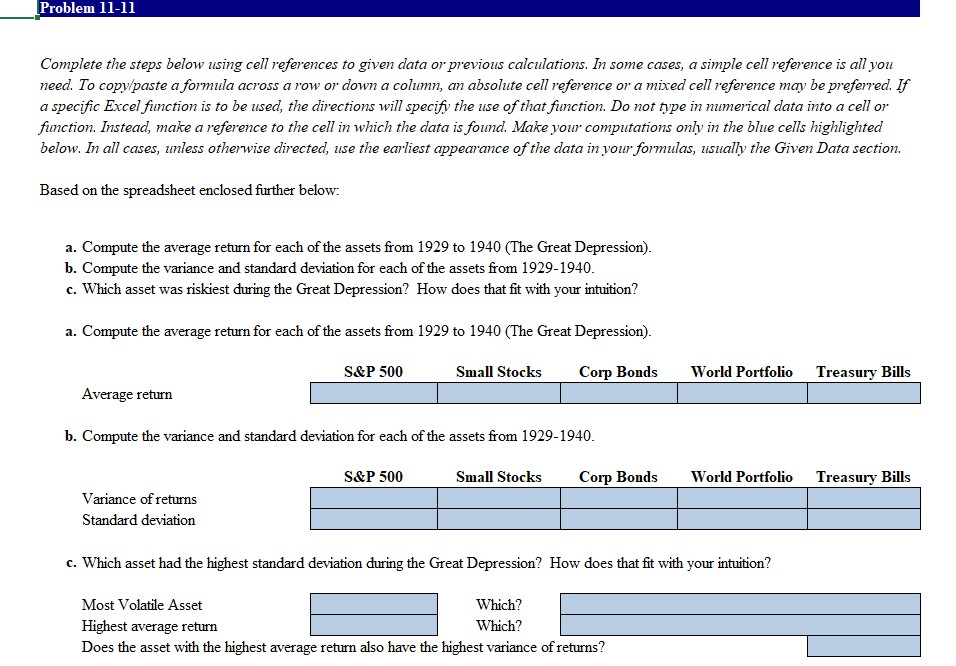
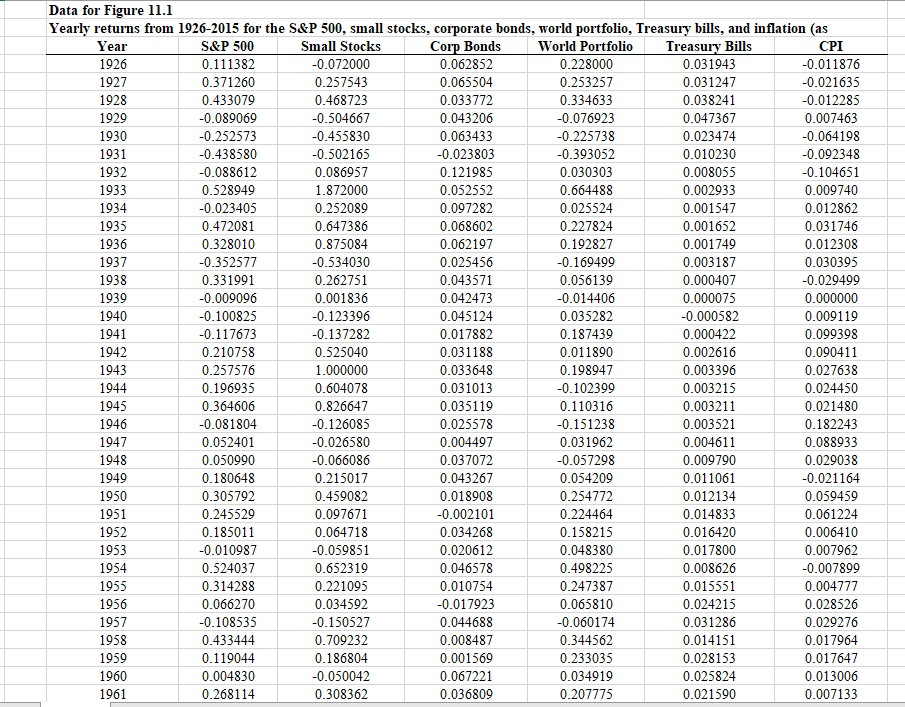
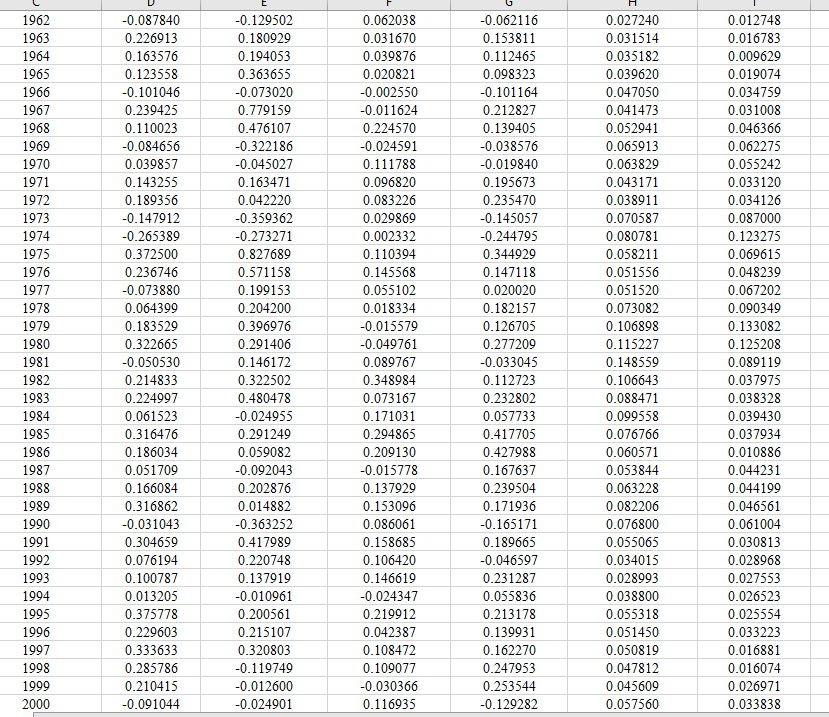
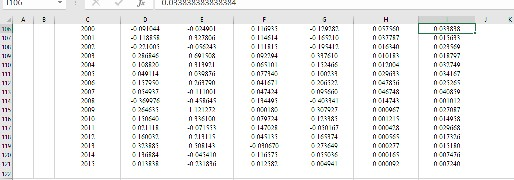
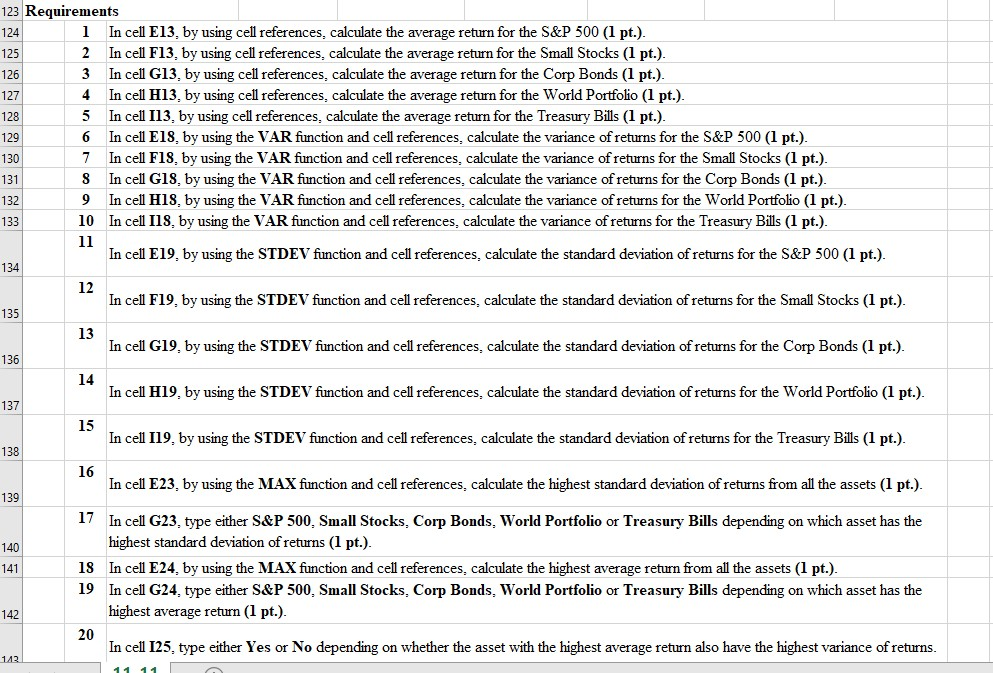
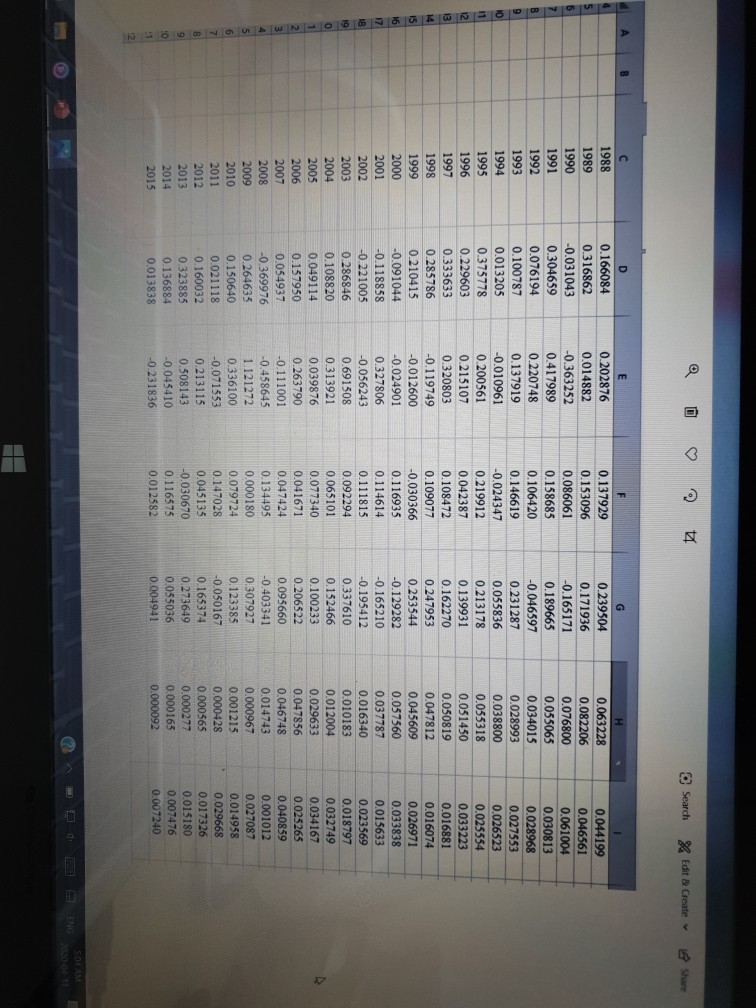
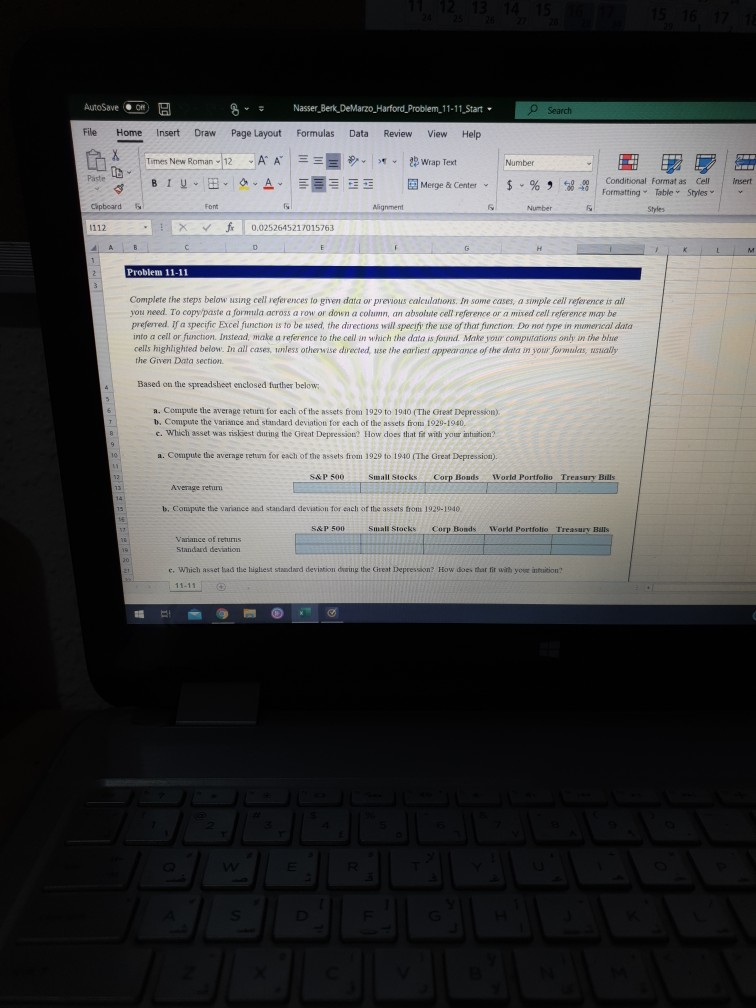
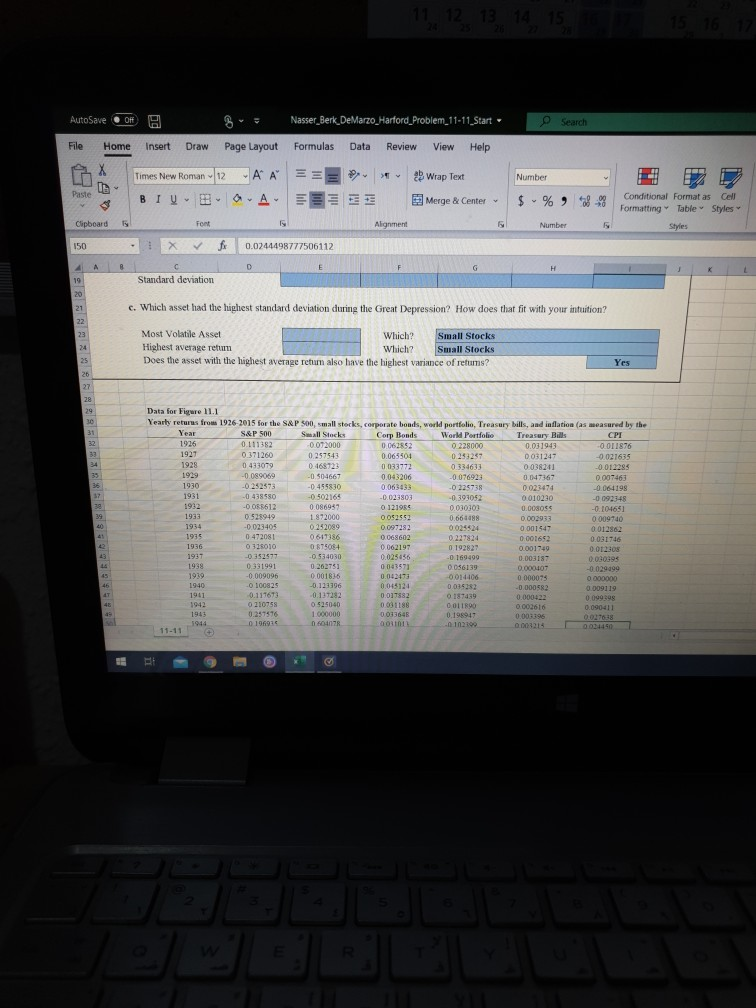
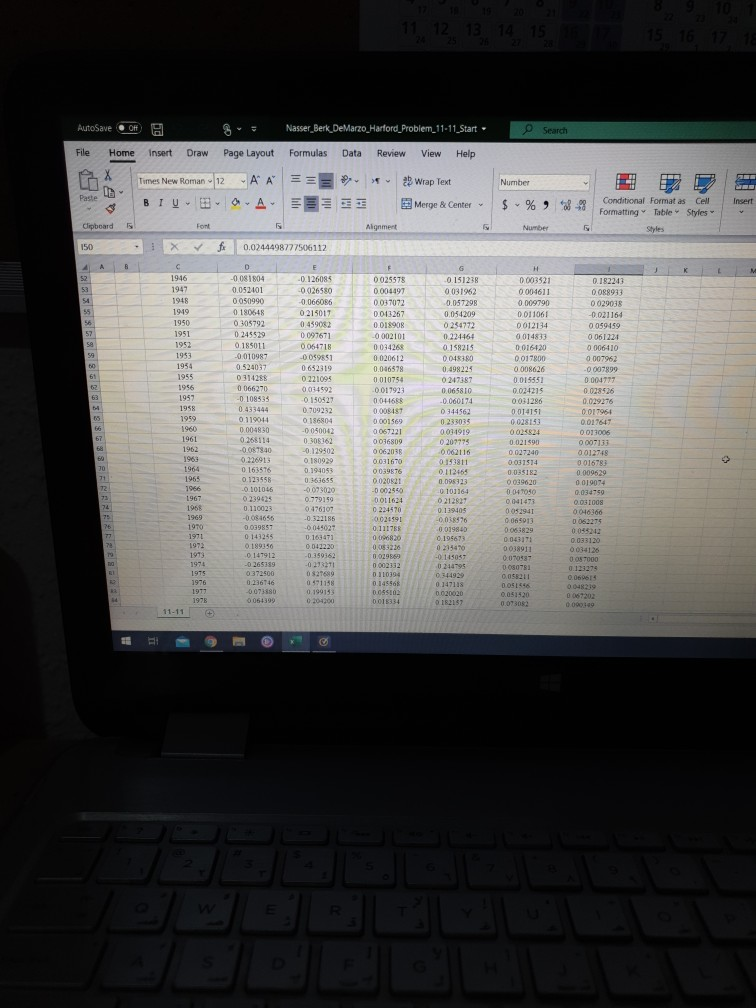
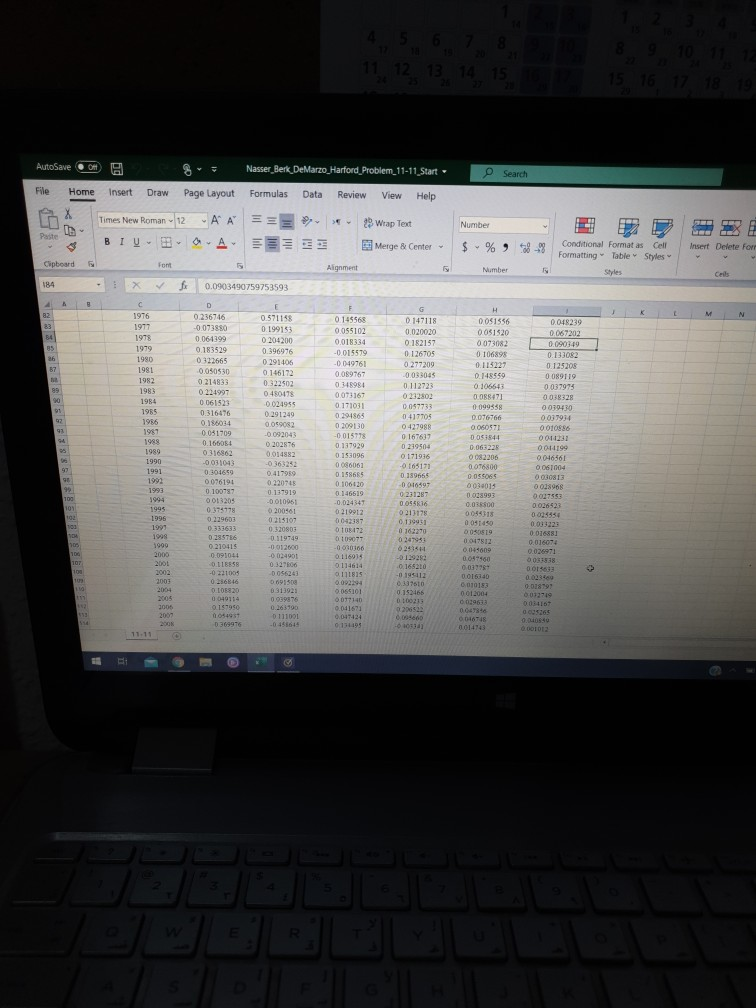
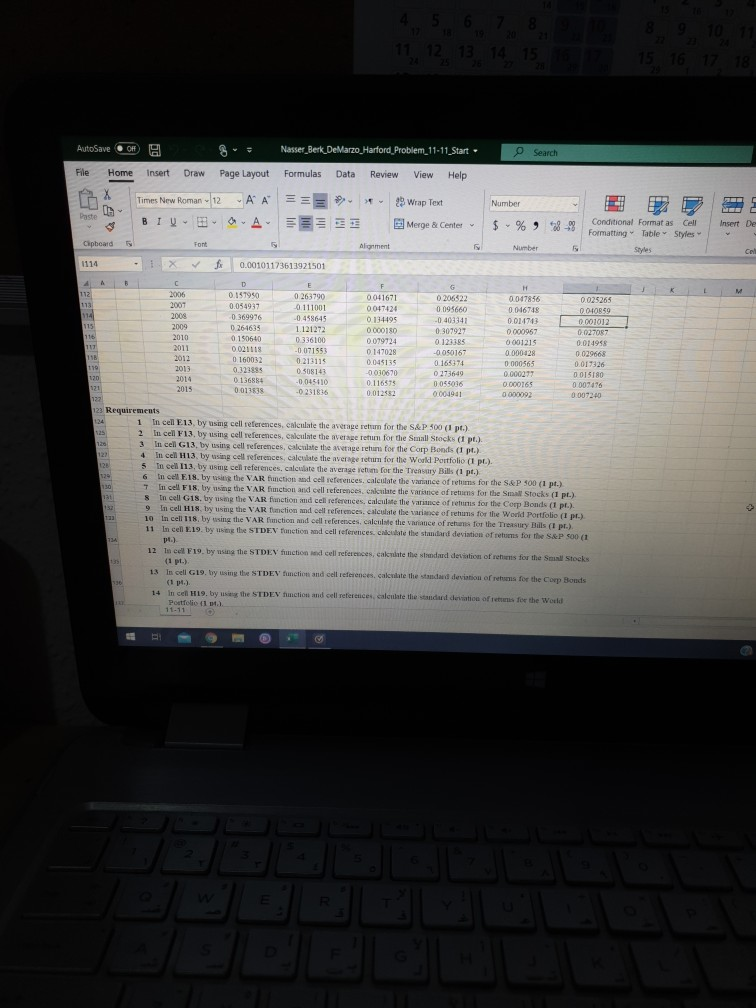
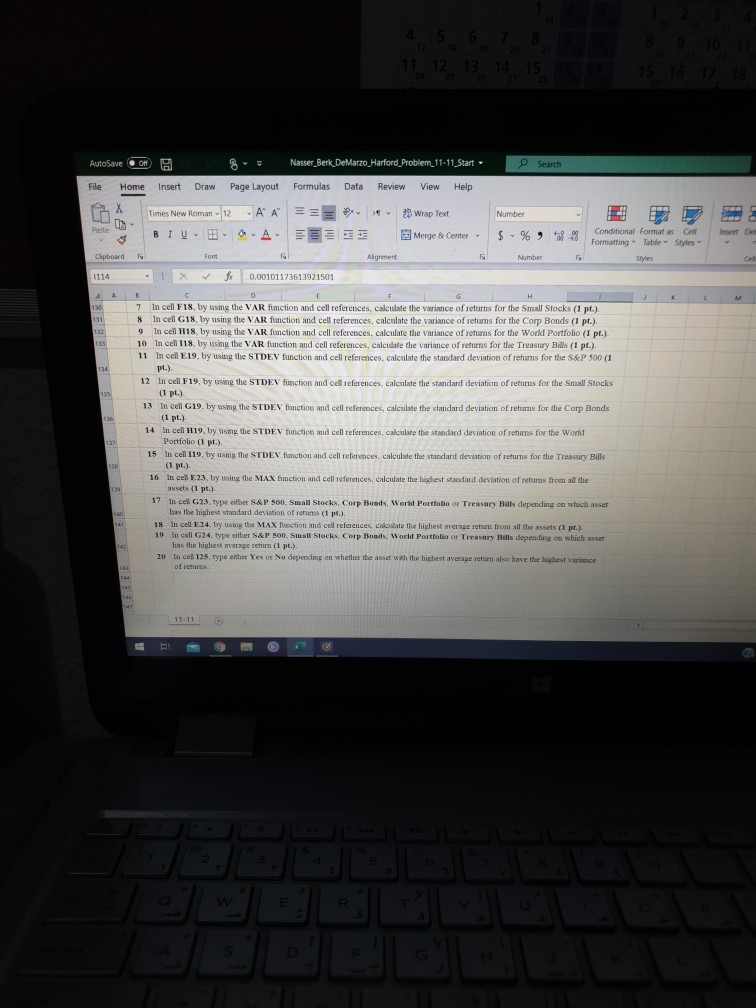
e Search AutoSave ODE 8 File Home Insert 8 Draw Nasser_Berk DeMarzo_Harford Problem.11-11.Start Formulas Data Review View Help Page Layout AA = * Times New Roman ~ 12 BIV A Wrap Text Merge & Center Number $ - %58- E ** Conditional Format as Cell Formatting Table Styles Clipboard Alignment Number 1112 - V f 0.0252645217015763 Problem 11-11 Complete the steps below using cell references to given data or previous calculations. In some cases, a simple cell reference is all you need. To copy paste a formal across a row or down a column, an absolute cell reference or a mixed cell reference may be preferred. If a specific Excel function is to be used the directions will specify theme of that function. Do not type in numerical data into a cell or function. Instead, make a reference to the cell in which the data is found. Make or computations only on the blue cells highlighted below. In all cases, unless otherwise directed, use the earliest appearance of the data in your formales, assally the Gnen Data section Based on the spreadsheet enclosed further below a. Compute the average return for each of theses from 1929 to 1940 (The Great Depression) b. Compute the Viced standard deviation for each of the assets from 1929-1940. c. Which asset was visliest during the Great Depression? How does that fit with your intuition? a. Compute the verge er for each of the assets from 1929 to 1910 The Great Depression) S&P 500 Small Stocks Corp Bouds World Portfolio Treasury Bills Average retum b. Compute the variance w standard deviation for each of the assets from 1920-1940 S&P 500 Small Stocks Corp Bonds World Portfolio Treasury Bills Varance of retums Standard destion e. Which assed the standard deviation during the Great Depression? How does that it with you on! AutoSave DE - Nasser_Berk DeMarzo Harford Problem_11-11_Start Search File Home Insert Draw Page Layout Formulas Data Review View Help HX == Number Times New Roman 12 A A BIU. BA Wrap Text Merge & Center - $ -% Conditional Format as Cell Formatting Table Styles Clipboard Alone 150 X V f 0.0244498777506112 Standard deviation c. Which asset had the highest standard deviation during the Great Depression? How does that fit with your intuition? Most Volatile Asset Which? Small Stocks Highest average retum Which? Small Stocks Does the asset with the highest average return also have the highest variance of refumtis? 1919 Data for Figwe ILI Yearly returns from 1926 2015 for the SAP SD, stocks, corporate bonds, w S&P 500 Sall Stack Corp Bonds 1926 0012000 0 062852 1927 0371260 0257543 0.065504 1928 0 433079 0.468723 0033772 -0.089069 -0.504667 0.043206 1930 0252593 -0.455830 0.06333 1931 -048SO -0502164 -0.023803 1922 O 0612 0.086932 01219 1933 0525949 1.872000 O 051551 1934 -0.023404 0.242099 0.097282 0.472081 0617186 O 063602 1936 0111010 0 T508+ 0062197 011277 0534030 0.025456 1939 1991 0.262751 0 043571 1919 -0.009096 0.001836 0.042473 102 -0.121196 0045120 TOTS 011 0.017532 031074 25040 DO 0257576 0.033645 DORT portfolio Treasury Bills, and inflation (as measured by the Word Portfolio Treasury Bills 0228000 0.031943 0011876 0232 0031247 - 021635 0 334613 0038241 0.012293 -0.076923 0.047367 0.007463 02271 0021474 0064198 0101052 0010230 -0092348 0.010101 0.00ROSS -0.004651 0.66 0002933 0009740 0024524 0001447 0.012862 0.031746 192827 0.001149 169499 DHEDS 0046139 DOT 00140 0 000075 0035332 2009119 000012 DO 00016 0163 1917 00031 Nasser_Berk DeMarzo_ Harford Problem_11-11_Start Search AutoSave Of = File Home Insert Draw Page Layout Times New Roman - 12 AA Data Review View Help Formulas == Wrap Text Number - Paste Merge & Center $ Insert % 9 2 9 Conditional Format as Cell Formatting Table Styles Style Alignment Number 1 X fo 0.0244498777506112 ETTOSTO 1946 1947 SISTO 1961DD 19:49 1950 1951 1952 - 081804 0052001 0050990 0.19064 0105792 0 245529 0.185011 -0.01097 0.524037 0314285 0066270 -0.109435 0433444 0 119011 000410 026115 00350 0025578 0001097 0.03 7072 0.001257 0018908 0002101 00842 0.020612 0.046578 0010754 0017923 004668 0.008 1 -0.126085 0026530 066086 0215017 045908 0097671 0066718 009 0652319 0221095 001459 150421 0709232 104 00500 162 - 129502 OTS0999 1953 0001521 01004611 0009790 0011061 0012134 0.014813 0 016420 0.017800 0008626 0.015551 0024215 001296 DOTASI O 08933 00290 0021154 0049459 0061224 0 006-110 0 007962 -0.00799 000417 0023926 05729 0.054209 0256772 0.224464 015215 ODIO 0498224 0218 0.068 006017 563 1954 1955 1956 1949 195 1999 SLOO 16.100 19TOO sotto EL000 SPOO 18.10 1919 0207979 0062115 193811 0112465 1961 0014924 0102190 0.027240 031514 0:035182 0039620 0.047050 0.041473 1964 1965 0163576 0.123558 01010 0230625 0.110023 -0.084656 1967 1968 1969 0036609 006203 0.031670 0039576 0020821 -0002540 0011624 0 224570 0021591 0.111758 0.006820 0. 02 0.01959 0.002332 0110394 0103164 212821 0119105 0.163655 009020 0.779159 0416107 0122186 049027 0161471 041220 0.00014 0.034750 O OTON 0016160 LS100 OTO 03829 1971 1972 0 143245 0199156 OLIO 0033 0014136 10 19 TO 15.000 026579 0372 23616 st OL 0.051556 50 DOSSI 0.01533 1900 0204000 003082 100 11-11 AutoSave O S Nasser Berk DeMarzo_Harford Problem_11-11. Start File Home Insert Draw Page Layout Formulas Data Review View Help X = Times New Roman - 12 BIU-B O AA A = E Wrap Text Merge & Center - Number $ % , 6-8 * Conditional Formatas Cell Formatting Table Styles Insert Delete for Chipboard Alignment Number - 1 X 0.0903490759753593 1976 1977 1978 1979 1990 1981 0571148 199153 0206200 0.396976 0291406 146172 133502 008 0024955 0.291249 09082 0092043 0202876 0014882 OT GOS5102 0018334 -0.015579 0049761 0089767 028984 015167 171031 0 147118 0020020 0 112157 0126705 0277209 0033045 112923 0051556 O 051920 0.073082 0106898 0115227 148399 010663 0029 067202 0090149 01108 012203 09119 0236746 0930 006399 0.183529 0112665 0.050530 0214833 0224997 0061523 0.316416 0.16034 0 041909 0.16605+ 0 11662 0031043 300669 1983 1985 1986 020030 0-09955 0.076766 O 060571 DO1844 00012 0417705 0420R 0167617 0219504 0171916 0 0151 OLE 0039430 0011914 0010886 0 0 O OLLO 0461 051004 DOROT 1988 1989 1990 153096 6061 LLIS 0417989 DOTLE 0.137919 300 FEODEO 106030 0016597 1993 0.100757 013205 0 2012 00105 0.024547 O 02652 DOSSR 16 0211178 0. 0 00 0044115 0229603 333633 01092 004 108 112 16220 200461 025107 500 1979 0012600 090 0210315 116 19 2001 DIES -022100 -01112 0234 sne 002194 19 CREO 11 AutoSave O A Nasser_Berk DeMarzo. Harford Problem. 11-11. Start e Search File Home Insert Draw Page Layout Formulas Data Review View Help Times New Roman - 12 -AA Wrap Text Number Conditional Format as Cell Formatting Table Styles Insert DV Capboard font Alignment 1 X 0.00101173613921501 2006 2007 0.025264 0040 0.001012 2009 0.157950 0 044917 0169976 0254624 150640 0021115 0 160032 0.12915 1368 0:01357 2010 0263790 0.111001 -0.4486 1 121212 0336100 -0 071553 0.213115 0.508143 -0045410 -0 231815 0041671 0047424 O DE 0.000100 099724 0 147028 0.045139 0010670 0.116*** 0.012 026522 0.095660 01141 0.301929 0123385 -0.050167 0165374 0273649 0055016 001 0.007856 0.01671 0.013 0000067 000121 0.00002 0 000565 0.0749 0 029665 0.011326 DOISTO 2013 2014 123 Requirements 1 In cell E13, by using cell references, calculate the average return for the S&P 500 (1 pr.) 2 In cell F13 by using cell references, calculate the verge return for the Sull Stocks (1 p.) 3 In cell G13 by using cell references, calculate the term for the Corp Bonds (1 p.) 4 In cell 13 by using cell references, calculate the return for the Work Portfolio (1 ) 5 T cell 113. by cell references, calculate the rem for the Tray Balis (1 p.) 6 In cel E. 18. by the VAR action model references, calculate the variance of returns for the S&P 500 (1 pt.) 7 In cell FIN, try using the VAR fiction and cell reference calculate the variance of returns for the Small Stocks (1 pr.) In cell G18, ty time the VAR function and cell references, calculate the variance ofre for the Corp Bonds (1 pr.) Insell H y ising the VAR function and cell reference calculate the variace of rehims for the World Portfolio (1 p.) 10 In cell 118, by using the VAR nction and cell references, calculate the V e of or the Tr y is (1 p.) 11 In 19. by the STDEV Taction and cellence. C e the standard deviatio ns for the S&P 500 (1 12 In cel F19 by the STDEV actio cell references, cake the stand det of for the Sun Stocks 13 Insell G19, try using the STDEV function and cell references calculate the standard deviation of his for the Cop Bonds (1 p.) 14 In 19, by the STDEV action and cellence calculate the dev o te for the W 12-11 AutoSave Of A 8 Nasser_Berk_DeMarzo_Harford Problem_11-11_Start. e Search File Home Insert Draw Page Layout Formulas Data Review View Help > Number Times New Roman 12 BIUR O AA -A == E 2 Wrap Text Merge & Center - $ -% 9 8-9 Conditional format as Cell Formatting Table Styles Insert DE Agent - X V f 0.00101173613921501 7 In cel F18, by using the VAR function and cell references, calculate the variance of returns for the Small Stocks (1 pt.). 8 In cell G18, by using the VAR function and cell references, calculate the vince of returns for the Corp Bonds (1 pr.). 9 In cell 18. by using the VAR function and cell references, calculate the rice of returns for the World Portfolio (1 pr.) 10 In cell 118, by using the VAR function and cell references, calculate the variance of returns for the Treasury Bills (1 pr.). 11 In cell E19. by using the STDEV function and cell references, calculate the standard deviation of returns for the S&P 500 (1 pt.) 12 In cell F19, by using the STDEVfunction and references calculate the standard deviation of returns for the Small Stocks (1 p.) 13 In cell G19. by using the STDEV fimction and cell references, calculate the standard deviation of returns for the Corp Bonds (1 pt.) 14 In cell 1119, by using the STDEN function and cell references, calculate the standard deviation of returns for the World Portfolio (1 p.) 15 In cell 119, by using the STDEV function and cell references. calculate the standard deviation of retins for the Treasury Bills (1 p.) 16 in cel E.2.3, by using the MAX function and cell references, calculate the highest standard deviation of refums from all the (1 p.) 17 in cell G23, type the S&P 500. Small Stocks, Corp Bonds, World Portfolio or Treasury Bills depending on which asser un the highest indard deviation of res (1 pr.) 1N in cell 124. brytising the MAX Bunction and cell references calculate the highest average return from all theses (1 pr.) 19 in cell G24 type S&P 500, Small Stocks Corp Bonds, World Portfolio or Treasury Bills depending on which set luas the latest v erum (1 pr.) 20 Inch 12 type eher Yes No depending on whether the set with the highest average real have the b est varice of returns Problem 11-11 Complete the steps below using cell references to given data or previous calculations. In some cases, a simple cell reference is all you need. To copy/paste a formula across a row or down a column, an absolute cell reference or a mixed cell reference may be preferred. If a specific Excel function is to be used, the directions will specify the use of that function. Do not type in numerical data into a cell or function. Instead, make a reference to the cell in which the data is found. Make your computations only in the blue cells highlighted below. In all cases, unless otherwise directed, use the earliest appearance of the data in your formulas, usually the Given Data section. Based on the spreadsheet enclosed further below: a. Compute the average return for each of the assets from 1929 to 1940 (The Great Depression). b. Compute the variance and standard deviation for each of the assets from 1929-1940. c. Which asset was riskiest during the Great Depression? How does that fit with your intuition? a. Compute the average return for each of the assets from 1929 to 1940 (The Great Depression). S&P 500 Small Stocks Corp Bonds World Portfolio Treasury Bills Average return b. Compute the variance and standard deviation for each of the assets from 1929-1940. S&P 500 Small Stocks Corp Bonds World Portfolio Treasury Bills Variance of returns Standard deviation c. Which asset had the highest standard deviation during the Great Depression? How does that fit with your intuition? Most Volatile Asset Which? Highest average return Which? Does the asset with the highest average return also have the highest variance of returns? Data for Figure 11.1 Yearly returns from 1926-2015 for the S&P 500, small stocks, corporate bonds, world portfolio, Treasury bills, and inflation (as Year S&P 500 Small Stocks Corp Bonds World Portfolio Treasury Bills CPI 1926 0.111382 -0.072000 0.062852 0.228000 0.031943 -0.011876 1927 0.371260 0.257543 0.065504 0.253257 0.031247 -0.021635 1928 0.433079 0.468723 0.033772 0.334633 0.038241 -0.012285 1929 -0.089069 -0.504667 0.043206 -0.076923 0.047367 0.007463 1930 -0.252573 -0.455830 0.063433 -0.225738 0.023474 -0.064198 1931 -0.438580 -0.502165 -0.023803 -0.393052 0.010230 -0.092348 1932 -0.088612 0.086957 0.121985 0.030303 0.008055 -0.104651 1933 0.528949 1.872000 0.052552 0.664488 0.002933 0.009740 1934 -0.023405 0.252089 0.097282 0.025524 0.001547 0.012862 1935 0.472081 0.647386 0.068602 0.227824 0.001652 0.031746 1936 0.328010 0.875084 0.062197 0.192827 0.001749 0.012308 1937 -0.352577 -0.534030 0.025456 -0.169499 0.003187 0.030395 1938 0.331991 0.262751 0.043571 0.056139 0.000407 -0.029499 1939 -0.009096 0.001836 0.042473 -0.014406 0.000075 0.000000 1940 -0.100825 -0.123396 0.045124 0.035282 -0.000582 0.009119 1941 -0.117673 -0.137282 0.017882 0.187439 0.000422 0.099398 1942 0.210758 0.525040 0.031188 0.011890 0.002616 0.090411 1943 0.257576 1.000000 0.033648 0.198947 0.003396 0.027638 1944 0.196935 0.604078 0.031013 -0.102399 0.003215 0.024450 1945 0.364606 0.826647 0.035119 0.110316 0.003211 0.021480 1946 -0.081804 -0.126085 0.025578 -0.151238 0.003521 0.182243 1947 0.052401 -0.026580 0.004497 0.031962 0.004611 0.088933 1948 0.050990 -0.066086 0.037072 -0.057298 0.009790 0.029038 1949 0.180648 0.215017 0.043267 0.054209 0.011061 -0.021164 1950 0.305792 0.459082 0.018908 0.254772 0.012134 0.059459 1951 0.245529 0.097671 -0.002101 0.224464 0.014833 0.061224 1952 0.185011 0.064718 0.034268 0.158215 0.016420 0.006410 1953 -0.010987 -0.059851 0.020612 0.048380 0.017800 0.007962 1954 0.524037 0.652319 0.046578 0.498225 0.008626 -0.007899 1955 0.314288 0.221095 0.010754 0.247387 0.015551 0.004777 1956 0.066270 0.034592 -0.017923 0.065810 0.024215 0.028526 1957 -0.108535 -0.150527 0.044688 -0.060174 0.031286 0.029276 1958 0.433444 0.709232 0.008487 0.344562 0.014151 0.017964 1959 0.119044 0.186804 0.001569 0.233035 0.028153 0.017647 1960 0.004830 -0.050042 0.067221 0.034919 0.025824 0.013006 1961 0.268114 0.308362 0.036809 0.207775 0.021590 0.007133 L 1967 1963 1964 1965 1966 1967 1968 1969 1970 1971 1972 1973 1974 1975 1976 1977 1978 1979 1980 1981 1982 1983 1984 1985 1986 1987 1988 1989 1990 1991 1992 1993 1994 1995 1996 1997 1998 1999 2000 -0.087840 0.226913 0.163376 0.123558 -0.101046 0.239425 0.110023 -0.084656 0.039857 0.143255 | 0.189356 -0.147912 -0.265389 0372500 0236746 -0.073880 0.064399 0.183529 0.322665 -0.050530 0.214833 0.224997 0.06153 0316476 0.186034 0.051709 | 0.166084 0.316862 -0.031043 0.304659 0.07614 0.100787 0.013205 0375778 0.229603 0.333633 0.285786 0.210415 -0.09104 -0.129502 0.180929 0.194053 0.363655 -0.073020 0.77919 0.476107 -0.322186 -0.045027 0.163471 0.042220 -0.359362 -0.273271 0.827689 0371158 0.19913 0204200 0.396976 0.291406 0.146172 0322502 0.480478 -0.024955 091242 0.059082 -0.092043 0.202876 0.014882 -0.363252 0.417989 0220748 0.137919 -0.010961 0.200561 0.215107 0.320803 -0.119749 -0.012600 -0.024901 0.062038 0.031670 0.039876 0.020821 -0.002530 -0.011624 0224570 -0.024591 0111788 0.096820 0.083226 0.029869 0.002332 0.110394 0.145568 0.055102 0.018334 -0.015579 -0.049761 0.089767 0348984 0.073167 0.171031 0.294865 0.209130 -0.015778 0.137929 0.153096 0.086061 0.158685 0.106420 0.146619 -0.024347 10.219912 0.042387 0.108472 0.109077 -0.030366 0.116935 -0.062116 10.153811 0.112465 0.098323 -0.10114 0.212827 0.139405 -0.038576 -0.019840 10.193673 0.23470 -0.145057 -0.244793 10.344929 0.147118 0.020020 0.182157 10.126705 0.277209 -0.033045 0.112723 0.232802 0.057733 0.417705 0.427988 10.167637 0.239504 0.171936 -0.165171 0.189665 -0.046597 0.231287 0.055836 0213178 0.139931 0.162270 0.247953 0.253544 -0.129282 0.027240 0.031514 0.033182 0.039620 10.047050 0.041473 0.052941 0.065913 0.063829 0.043171 0.038911 0.070587 0.080781 0.058211 0.051536 0.051520 0.073082 10.106898 | 0.115227 0.148559 10.106643 0.088471 0.099538 0.076766 0.060571 10.05384 0.063228 0.082206 0.076800 0.053065 0.034013 0.028993 0.038800 0.05318 0.051450 0.050819 0.047812 | 0.045609 0.057560 | 0.012748 0.016783 0.009629 0.019074 0.034759 0.031008 0.046366 0.062275 10.053242 0.033120 0.034126 0.087000 0.123275 0.069615 0.048239 0.067202 0.090349 0.133082 0.125208 0.089119 0.037975 0.038328 0.039430 0.037934 10.010886 0.044231 0.044199 0.046561 0.061004 0.030813 0.028968 0.027553 0.026523 0.02554 0.033223 0.016881 0.016074 0.026971 0.033838 104 -1024051 0127 0155210 0199412 07510 01:24.is 1063 $310120 D -514 D11: 092704 Ossin 09740 004157 0047424 05743 n 18 919031 OSGB 3290 0101 114551145 | 121272 0986100 0152990 27 01749 noun 0245 810 00 0193 478 45218 0014743 Cocos 000182 0090724 147025 0907997 0123187 0918 1600 393581 SLILIL V SFIEV V V70 155174 OT 00:25 02-18 C0033 007 101110 SS120. U CO2092 UFCV.V 123 Requirements 1 In cell E13, by using cell references, calculate the average return for the S&P 500 (1 pt.). 2 In cell F13, by using cell references, calculate the average return for the Small Stocks (1 pt.). 3 In cell G13, by using cell references, calculate the average return for the Corp Bonds (1 pt.). 4 In cell H13, by using cell references, calculate the average return for the World Portfolio (1 pt.). 5 In cell 113, by using cell references, calculate the average return for the Treasury Bills (1 pt.) 6 In cell E18, by using the VAR function and cell references, calculate the variance of returns for the S&P 500 (1 pt.). 7 In cell F18, by using the VAR function and cell references, calculate the variance of returns for the Small Stocks (1 pt.). 8 In cell GIS, by using the VAR function and cell references, calculate the variance of returns for the Corp Bonds (1 pt.). 9 In cell H18, by using the VAR function and cell references, calculate the variance of returns for the World Portfolio (1 pt.). 10 In cell 118, by using the VAR function and cell references, calculate the variance of returns for the Treasury Bills (1 pt.). 132 In cell E19. by using the STDEV function and cell references, calculate the standard deviation of returns for the S&P 500 (1 pt.). 134 In cell F19, by using the STDEV function and cell references, calculate the standard deviation of returns for the Small Stocks (1 pt.). 135 In cell G19, by using the STDEV function and cell references, calculate the standard deviation of returns for the Corp Bonds (1 pt.). In cell H19, by using the STDEV function and cell references, calculate the standard deviation of returns for the World Portfolio (1 pt.). In cell 119, by using the STDEV function and cell references, calculate the standard deviation of returns for the Treasury Bills (1 pt.). 138 In cell E23, by using the MAX function and cell references, calculate the highest standard deviation of returns from all the assets (1 pt.). 139 140 141 In cell G23, type either S&P 500. Small Stocks, Corp Bonds, World Portfolio or Treasury Bills depending on which asset has the highest standard deviation of returns (1 pt.). In cell E24. by using the MAX function and cell references, calculate the highest average return from all the assets (1 pt.). 19 In cell G24, type either S&P 500. Small Stocks, Corp Bonds, World Portfolio or Treasury Bills depending on which asset has the highest average return (1 pt.). 142 In cell 125, type either Yes or No depending on whether the asset with the highest average return also have the highest variance of returns. 113 1111 Q & A Search Edita Greate Share 1988 1989 1990 1991 1992 1993 1994 1995 1996 1997 1998 1999 2000 2001 2002 2003 2004 2005 2006 2007 2008 2009 2010 2011 2012 2013 2014 2015 0.166084 0.316862 -0.031043 0.304659 0.076194 0.100787 0.013205 0.375778 0.229603 0.333633 0.285786 0.210415 -0.091044 -0.118858 -0.221005 0.286846 0.108820 0.049114 0.157950 0.054937 -0.369976 0.264635 0.150640 0.021118 0.160032 0.323885 0.136884 0.013838 0.202876 0.014882 -0.363252 0.417989 0.220748 0.137919 -0.010961 0.200561 0.215107 0.320803 -0.119749 -0.012600 -0.024901 0.327806 -0.056243 0.691508 0.313921 0.039876 0.263790 -0.111001 -0.458645 1.121272 0.336100 -0.071553 0.213115 0.508143 -0.045410 -0.231836 0.137929 0.153096 0.086061 0.158685 0.106420 0.146619 -0.024347 0.219912 0.042387 0.108472 0.109077 -0.030366 0.116935 0.114614 0.111815 0.092294 0.065101 0.077340 0.041671 0.047424 0.134495 0.000180 0.079724 0.147028 0.045135 -0.030670 0.116575 0.012582 0.239504 0.171936 -0.165171 0.189665 -0.046597 0.231287 0.055836 0.213178 0.139931 0.162270 0.247953 0.253544 -0.129282 -0.165210 -0.195412 0.337610 0.152466 0.100233 0.206522 0.095660 -0.403341 0.307927 0.123385 -0.050167 0.165374 0.273649 0.055036 0.004941 H 0.063228 0.082206 0.076800 0.055065 0.034015 0.028993 0.038800 0.055318 0.051450 0.050819 0.047812 0.045609 0.057560 0.037787 0.016340 0.010183 0.012004 0.029633 0.047856 0.046748 0.014743 0.000967 0.001215 0.000428 0.000565 0.000277 0.000165 0.000092 0.044199 0.046561 0.061004 0.030813 0.028968 0.027553 0.026523 0.025554 0.033223 0.016881 0.016074 0.026971 0.033838 0.015633 0.023569 0.018797 0.032749 0.034167 0.025265 0.040859 0.001012 0.027087 0.014958 0.029668 0.017326 0.015180 0.007476 0.007240 e Search AutoSave ODE 8 File Home Insert 8 Draw Nasser_Berk DeMarzo_Harford Problem.11-11.Start Formulas Data Review View Help Page Layout AA = * Times New Roman ~ 12 BIV A Wrap Text Merge & Center Number $ - %58- E ** Conditional Format as Cell Formatting Table Styles Clipboard Alignment Number 1112 - V f 0.0252645217015763 Problem 11-11 Complete the steps below using cell references to given data or previous calculations. In some cases, a simple cell reference is all you need. To copy paste a formal across a row or down a column, an absolute cell reference or a mixed cell reference may be preferred. If a specific Excel function is to be used the directions will specify theme of that function. Do not type in numerical data into a cell or function. Instead, make a reference to the cell in which the data is found. Make or computations only on the blue cells highlighted below. In all cases, unless otherwise directed, use the earliest appearance of the data in your formales, assally the Gnen Data section Based on the spreadsheet enclosed further below a. Compute the average return for each of theses from 1929 to 1940 (The Great Depression) b. Compute the Viced standard deviation for each of the assets from 1929-1940. c. Which asset was visliest during the Great Depression? How does that fit with your intuition? a. Compute the verge er for each of the assets from 1929 to 1910 The Great Depression) S&P 500 Small Stocks Corp Bouds World Portfolio Treasury Bills Average retum b. Compute the variance w standard deviation for each of the assets from 1920-1940 S&P 500 Small Stocks Corp Bonds World Portfolio Treasury Bills Varance of retums Standard destion e. Which assed the standard deviation during the Great Depression? How does that it with you on! AutoSave DE - Nasser_Berk DeMarzo Harford Problem_11-11_Start Search File Home Insert Draw Page Layout Formulas Data Review View Help HX == Number Times New Roman 12 A A BIU. BA Wrap Text Merge & Center - $ -% Conditional Format as Cell Formatting Table Styles Clipboard Alone 150 X V f 0.0244498777506112 Standard deviation c. Which asset had the highest standard deviation during the Great Depression? How does that fit with your intuition? Most Volatile Asset Which? Small Stocks Highest average retum Which? Small Stocks Does the asset with the highest average return also have the highest variance of refumtis? 1919 Data for Figwe ILI Yearly returns from 1926 2015 for the SAP SD, stocks, corporate bonds, w S&P 500 Sall Stack Corp Bonds 1926 0012000 0 062852 1927 0371260 0257543 0.065504 1928 0 433079 0.468723 0033772 -0.089069 -0.504667 0.043206 1930 0252593 -0.455830 0.06333 1931 -048SO -0502164 -0.023803 1922 O 0612 0.086932 01219 1933 0525949 1.872000 O 051551 1934 -0.023404 0.242099 0.097282 0.472081 0617186 O 063602 1936 0111010 0 T508+ 0062197 011277 0534030 0.025456 1939 1991 0.262751 0 043571 1919 -0.009096 0.001836 0.042473 102 -0.121196 0045120 TOTS 011 0.017532 031074 25040 DO 0257576 0.033645 DORT portfolio Treasury Bills, and inflation (as measured by the Word Portfolio Treasury Bills 0228000 0.031943 0011876 0232 0031247 - 021635 0 334613 0038241 0.012293 -0.076923 0.047367 0.007463 02271 0021474 0064198 0101052 0010230 -0092348 0.010101 0.00ROSS -0.004651 0.66 0002933 0009740 0024524 0001447 0.012862 0.031746 192827 0.001149 169499 DHEDS 0046139 DOT 00140 0 000075 0035332 2009119 000012 DO 00016 0163 1917 00031 Nasser_Berk DeMarzo_ Harford Problem_11-11_Start Search AutoSave Of = File Home Insert Draw Page Layout Times New Roman - 12 AA Data Review View Help Formulas == Wrap Text Number - Paste Merge & Center $ Insert % 9 2 9 Conditional Format as Cell Formatting Table Styles Style Alignment Number 1 X fo 0.0244498777506112 ETTOSTO 1946 1947 SISTO 1961DD 19:49 1950 1951 1952 - 081804 0052001 0050990 0.19064 0105792 0 245529 0.185011 -0.01097 0.524037 0314285 0066270 -0.109435 0433444 0 119011 000410 026115 00350 0025578 0001097 0.03 7072 0.001257 0018908 0002101 00842 0.020612 0.046578 0010754 0017923 004668 0.008 1 -0.126085 0026530 066086 0215017 045908 0097671 0066718 009 0652319 0221095 001459 150421 0709232 104 00500 162 - 129502 OTS0999 1953 0001521 01004611 0009790 0011061 0012134 0.014813 0 016420 0.017800 0008626 0.015551 0024215 001296 DOTASI O 08933 00290 0021154 0049459 0061224 0 006-110 0 007962 -0.00799 000417 0023926 05729 0.054209 0256772 0.224464 015215 ODIO 0498224 0218 0.068 006017 563 1954 1955 1956 1949 195 1999 SLOO 16.100 19TOO sotto EL000 SPOO 18.10 1919 0207979 0062115 193811 0112465 1961 0014924 0102190 0.027240 031514 0:035182 0039620 0.047050 0.041473 1964 1965 0163576 0.123558 01010 0230625 0.110023 -0.084656 1967 1968 1969 0036609 006203 0.031670 0039576 0020821 -0002540 0011624 0 224570 0021591 0.111758 0.006820 0. 02 0.01959 0.002332 0110394 0103164 212821 0119105 0.163655 009020 0.779159 0416107 0122186 049027 0161471 041220 0.00014 0.034750 O OTON 0016160 LS100 OTO 03829 1971 1972 0 143245 0199156 OLIO 0033 0014136 10 19 TO 15.000 026579 0372 23616 st OL 0.051556 50 DOSSI 0.01533 1900 0204000 003082 100 11-11 AutoSave O S Nasser Berk DeMarzo_Harford Problem_11-11. Start File Home Insert Draw Page Layout Formulas Data Review View Help X = Times New Roman - 12 BIU-B O AA A = E Wrap Text Merge & Center - Number $ % , 6-8 * Conditional Formatas Cell Formatting Table Styles Insert Delete for Chipboard Alignment Number - 1 X 0.0903490759753593 1976 1977 1978 1979 1990 1981 0571148 199153 0206200 0.396976 0291406 146172 133502 008 0024955 0.291249 09082 0092043 0202876 0014882 OT GOS5102 0018334 -0.015579 0049761 0089767 028984 015167 171031 0 147118 0020020 0 112157 0126705 0277209 0033045 112923 0051556 O 051920 0.073082 0106898 0115227 148399 010663 0029 067202 0090149 01108 012203 09119 0236746 0930 006399 0.183529 0112665 0.050530 0214833 0224997 0061523 0.316416 0.16034 0 041909 0.16605+ 0 11662 0031043 300669 1983 1985 1986 020030 0-09955 0.076766 O 060571 DO1844 00012 0417705 0420R 0167617 0219504 0171916 0 0151 OLE 0039430 0011914 0010886 0 0 O OLLO 0461 051004 DOROT 1988 1989 1990 153096 6061 LLIS 0417989 DOTLE 0.137919 300 FEODEO 106030 0016597 1993 0.100757 013205 0 2012 00105 0.024547 O 02652 DOSSR 16 0211178 0. 0 00 0044115 0229603 333633 01092 004 108 112 16220 200461 025107 500 1979 0012600 090 0210315 116 19 2001 DIES -022100 -01112 0234 sne 002194 19 CREO 11 AutoSave O A Nasser_Berk DeMarzo. Harford Problem. 11-11. Start e Search File Home Insert Draw Page Layout Formulas Data Review View Help Times New Roman - 12 -AA Wrap Text Number Conditional Format as Cell Formatting Table Styles Insert DV Capboard font Alignment 1 X 0.00101173613921501 2006 2007 0.025264 0040 0.001012 2009 0.157950 0 044917 0169976 0254624 150640 0021115 0 160032 0.12915 1368 0:01357 2010 0263790 0.111001 -0.4486 1 121212 0336100 -0 071553 0.213115 0.508143 -0045410 -0 231815 0041671 0047424 O DE 0.000100 099724 0 147028 0.045139 0010670 0.116*** 0.012 026522 0.095660 01141 0.301929 0123385 -0.050167 0165374 0273649 0055016 001 0.007856 0.01671 0.013 0000067 000121 0.00002 0 000565 0.0749 0 029665 0.011326 DOISTO 2013 2014 123 Requirements 1 In cell E13, by using cell references, calculate the average return for the S&P 500 (1 pr.) 2 In cell F13 by using cell references, calculate the verge return for the Sull Stocks (1 p.) 3 In cell G13 by using cell references, calculate the term for the Corp Bonds (1 p.) 4 In cell 13 by using cell references, calculate the return for the Work Portfolio (1 ) 5 T cell 113. by cell references, calculate the rem for the Tray Balis (1 p.) 6 In cel E. 18. by the VAR action model references, calculate the variance of returns for the S&P 500 (1 pt.) 7 In cell FIN, try using the VAR fiction and cell reference calculate the variance of returns for the Small Stocks (1 pr.) In cell G18, ty time the VAR function and cell references, calculate the variance ofre for the Corp Bonds (1 pr.) Insell H y ising the VAR function and cell reference calculate the variace of rehims for the World Portfolio (1 p.) 10 In cell 118, by using the VAR nction and cell references, calculate the V e of or the Tr y is (1 p.) 11 In 19. by the STDEV Taction and cellence. C e the standard deviatio ns for the S&P 500 (1 12 In cel F19 by the STDEV actio cell references, cake the stand det of for the Sun Stocks 13 Insell G19, try using the STDEV function and cell references calculate the standard deviation of his for the Cop Bonds (1 p.) 14 In 19, by the STDEV action and cellence calculate the dev o te for the W 12-11 AutoSave Of A 8 Nasser_Berk_DeMarzo_Harford Problem_11-11_Start. e Search File Home Insert Draw Page Layout Formulas Data Review View Help > Number Times New Roman 12 BIUR O AA -A == E 2 Wrap Text Merge & Center - $ -% 9 8-9 Conditional format as Cell Formatting Table Styles Insert DE Agent - X V f 0.00101173613921501 7 In cel F18, by using the VAR function and cell references, calculate the variance of returns for the Small Stocks (1 pt.). 8 In cell G18, by using the VAR function and cell references, calculate the vince of returns for the Corp Bonds (1 pr.). 9 In cell 18. by using the VAR function and cell references, calculate the rice of returns for the World Portfolio (1 pr.) 10 In cell 118, by using the VAR function and cell references, calculate the variance of returns for the Treasury Bills (1 pr.). 11 In cell E19. by using the STDEV function and cell references, calculate the standard deviation of returns for the S&P 500 (1 pt.) 12 In cell F19, by using the STDEVfunction and references calculate the standard deviation of returns for the Small Stocks (1 p.) 13 In cell G19. by using the STDEV fimction and cell references, calculate the standard deviation of returns for the Corp Bonds (1 pt.) 14 In cell 1119, by using the STDEN function and cell references, calculate the standard deviation of returns for the World Portfolio (1 p.) 15 In cell 119, by using the STDEV function and cell references. calculate the standard deviation of retins for the Treasury Bills (1 p.) 16 in cel E.2.3, by using the MAX function and cell references, calculate the highest standard deviation of refums from all the (1 p.) 17 in cell G23, type the S&P 500. Small Stocks, Corp Bonds, World Portfolio or Treasury Bills depending on which asser un the highest indard deviation of res (1 pr.) 1N in cell 124. brytising the MAX Bunction and cell references calculate the highest average return from all theses (1 pr.) 19 in cell G24 type S&P 500, Small Stocks Corp Bonds, World Portfolio or Treasury Bills depending on which set luas the latest v erum (1 pr.) 20 Inch 12 type eher Yes No depending on whether the set with the highest average real have the b est varice of returns Problem 11-11 Complete the steps below using cell references to given data or previous calculations. In some cases, a simple cell reference is all you need. To copy/paste a formula across a row or down a column, an absolute cell reference or a mixed cell reference may be preferred. If a specific Excel function is to be used, the directions will specify the use of that function. Do not type in numerical data into a cell or function. Instead, make a reference to the cell in which the data is found. Make your computations only in the blue cells highlighted below. In all cases, unless otherwise directed, use the earliest appearance of the data in your formulas, usually the Given Data section. Based on the spreadsheet enclosed further below: a. Compute the average return for each of the assets from 1929 to 1940 (The Great Depression). b. Compute the variance and standard deviation for each of the assets from 1929-1940. c. Which asset was riskiest during the Great Depression? How does that fit with your intuition? a. Compute the average return for each of the assets from 1929 to 1940 (The Great Depression). S&P 500 Small Stocks Corp Bonds World Portfolio Treasury Bills Average return b. Compute the variance and standard deviation for each of the assets from 1929-1940. S&P 500 Small Stocks Corp Bonds World Portfolio Treasury Bills Variance of returns Standard deviation c. Which asset had the highest standard deviation during the Great Depression? How does that fit with your intuition? Most Volatile Asset Which? Highest average return Which? Does the asset with the highest average return also have the highest variance of returns? Data for Figure 11.1 Yearly returns from 1926-2015 for the S&P 500, small stocks, corporate bonds, world portfolio, Treasury bills, and inflation (as Year S&P 500 Small Stocks Corp Bonds World Portfolio Treasury Bills CPI 1926 0.111382 -0.072000 0.062852 0.228000 0.031943 -0.011876 1927 0.371260 0.257543 0.065504 0.253257 0.031247 -0.021635 1928 0.433079 0.468723 0.033772 0.334633 0.038241 -0.012285 1929 -0.089069 -0.504667 0.043206 -0.076923 0.047367 0.007463 1930 -0.252573 -0.455830 0.063433 -0.225738 0.023474 -0.064198 1931 -0.438580 -0.502165 -0.023803 -0.393052 0.010230 -0.092348 1932 -0.088612 0.086957 0.121985 0.030303 0.008055 -0.104651 1933 0.528949 1.872000 0.052552 0.664488 0.002933 0.009740 1934 -0.023405 0.252089 0.097282 0.025524 0.001547 0.012862 1935 0.472081 0.647386 0.068602 0.227824 0.001652 0.031746 1936 0.328010 0.875084 0.062197 0.192827 0.001749 0.012308 1937 -0.352577 -0.534030 0.025456 -0.169499 0.003187 0.030395 1938 0.331991 0.262751 0.043571 0.056139 0.000407 -0.029499 1939 -0.009096 0.001836 0.042473 -0.014406 0.000075 0.000000 1940 -0.100825 -0.123396 0.045124 0.035282 -0.000582 0.009119 1941 -0.117673 -0.137282 0.017882 0.187439 0.000422 0.099398 1942 0.210758 0.525040 0.031188 0.011890 0.002616 0.090411 1943 0.257576 1.000000 0.033648 0.198947 0.003396 0.027638 1944 0.196935 0.604078 0.031013 -0.102399 0.003215 0.024450 1945 0.364606 0.826647 0.035119 0.110316 0.003211 0.021480 1946 -0.081804 -0.126085 0.025578 -0.151238 0.003521 0.182243 1947 0.052401 -0.026580 0.004497 0.031962 0.004611 0.088933 1948 0.050990 -0.066086 0.037072 -0.057298 0.009790 0.029038 1949 0.180648 0.215017 0.043267 0.054209 0.011061 -0.021164 1950 0.305792 0.459082 0.018908 0.254772 0.012134 0.059459 1951 0.245529 0.097671 -0.002101 0.224464 0.014833 0.061224 1952 0.185011 0.064718 0.034268 0.158215 0.016420 0.006410 1953 -0.010987 -0.059851 0.020612 0.048380 0.017800 0.007962 1954 0.524037 0.652319 0.046578 0.498225 0.008626 -0.007899 1955 0.314288 0.221095 0.010754 0.247387 0.015551 0.004777 1956 0.066270 0.034592 -0.017923 0.065810 0.024215 0.028526 1957 -0.108535 -0.150527 0.044688 -0.060174 0.031286 0.029276 1958 0.433444 0.709232 0.008487 0.344562 0.014151 0.017964 1959 0.119044 0.186804 0.001569 0.233035 0.028153 0.017647 1960 0.004830 -0.050042 0.067221 0.034919 0.025824 0.013006 1961 0.268114 0.308362 0.036809 0.207775 0.021590 0.007133 L 1967 1963 1964 1965 1966 1967 1968 1969 1970 1971 1972 1973 1974 1975 1976 1977 1978 1979 1980 1981 1982 1983 1984 1985 1986 1987 1988 1989 1990 1991 1992 1993 1994 1995 1996 1997 1998 1999 2000 -0.087840 0.226913 0.163376 0.123558 -0.101046 0.239425 0.110023 -0.084656 0.039857 0.143255 | 0.189356 -0.147912 -0.265389 0372500 0236746 -0.073880 0.064399 0.183529 0.322665 -0.050530 0.214833 0.224997 0.06153 0316476 0.186034 0.051709 | 0.166084 0.316862 -0.031043 0.304659 0.07614 0.100787 0.013205 0375778 0.229603 0.333633 0.285786 0.210415 -0.09104 -0.129502 0.180929 0.194053 0.363655 -0.073020 0.77919 0.476107 -0.322186 -0.045027 0.163471 0.042220 -0.359362 -0.273271 0.827689 0371158 0.19913 0204200 0.396976 0.291406 0.146172 0322502 0.480478 -0.024955 091242 0.059082 -0.092043 0.202876 0.014882 -0.363252 0.417989 0220748 0.137919 -0.010961 0.200561 0.215107 0.320803 -0.119749 -0.012600 -0.024901 0.062038 0.031670 0.039876 0.020821 -0.002530 -0.011624 0224570 -0.024591 0111788 0.096820 0.083226 0.029869 0.002332 0.110394 0.145568 0.055102 0.018334 -0.015579 -0.049761 0.089767 0348984 0.073167 0.171031 0.294865 0.209130 -0.015778 0.137929 0.153096 0.086061 0.158685 0.106420 0.146619 -0.024347 10.219912 0.042387 0.108472 0.109077 -0.030366 0.116935 -0.062116 10.153811 0.112465 0.098323 -0.10114 0.212827 0.139405 -0.038576 -0.019840 10.193673 0.23470 -0.145057 -0.244793 10.344929 0.147118 0.020020 0.182157 10.126705 0.277209 -0.033045 0.112723 0.232802 0.057733 0.417705 0.427988 10.167637 0.239504 0.171936 -0.165171 0.189665 -0.046597 0.231287 0.055836 0213178 0.139931 0.162270 0.247953 0.253544 -0.129282 0.027240 0.031514 0.033182 0.039620 10.047050 0.041473 0.052941 0.065913 0.063829 0.043171 0.038911 0.070587 0.080781 0.058211 0.051536 0.051520 0.073082 10.106898 | 0.115227 0.148559 10.106643 0.088471 0.099538 0.076766 0.060571 10.05384 0.063228 0.082206 0.076800 0.053065 0.034013 0.028993 0.038800 0.05318 0.051450 0.050819 0.047812 | 0.045609 0.057560 | 0.012748 0.016783 0.009629 0.019074 0.034759 0.031008 0.046366 0.062275 10.053242 0.033120 0.034126 0.087000 0.123275 0.069615 0.048239 0.067202 0.090349 0.133082 0.125208 0.089119 0.037975 0.038328 0.039430 0.037934 10.010886 0.044231 0.044199 0.046561 0.061004 0.030813 0.028968 0.027553 0.026523 0.02554 0.033223 0.016881 0.016074 0.026971 0.033838 104 -1024051 0127 0155210 0199412 07510 01:24.is 1063 $310120 D -514 D11: 092704 Ossin 09740 004157 0047424 05743 n 18 919031 OSGB 3290 0101 114551145 | 121272 0986100 0152990 27 01749 noun 0245 810 00 0193 478 45218 0014743 Cocos 000182 0090724 147025 0907997 0123187 0918 1600 393581 SLILIL V SFIEV V V70 155174 OT 00:25 02-18 C0033 007 101110 SS120. U CO2092 UFCV.V 123 Requirements 1 In cell E13, by using cell references, calculate the average return for the S&P 500 (1 pt.). 2 In cell F13, by using cell references, calculate the average return for the Small Stocks (1 pt.). 3 In cell G13, by using cell references, calculate the average return for the Corp Bonds (1 pt.). 4 In cell H13, by using cell references, calculate the average return for the World Portfolio (1 pt.). 5 In cell 113, by using cell references, calculate the average return for the Treasury Bills (1 pt.) 6 In cell E18, by using the VAR function and cell references, calculate the variance of returns for the S&P 500 (1 pt.). 7 In cell F18, by using the VAR function and cell references, calculate the variance of returns for the Small Stocks (1 pt.). 8 In cell GIS, by using the VAR function and cell references, calculate the variance of returns for the Corp Bonds (1 pt.). 9 In cell H18, by using the VAR function and cell references, calculate the variance of returns for the World Portfolio (1 pt.). 10 In cell 118, by using the VAR function and cell references, calculate the variance of returns for the Treasury Bills (1 pt.). 132 In cell E19. by using the STDEV function and cell references, calculate the standard deviation of returns for the S&P 500 (1 pt.). 134 In cell F19, by using the STDEV function and cell references, calculate the standard deviation of returns for the Small Stocks (1 pt.). 135 In cell G19, by using the STDEV function and cell references, calculate the standard deviation of returns for the Corp Bonds (1 pt.). In cell H19, by using the STDEV function and cell references, calculate the standard deviation of returns for the World Portfolio (1 pt.). In cell 119, by using the STDEV function and cell references, calculate the standard deviation of returns for the Treasury Bills (1 pt.). 138 In cell E23, by using the MAX function and cell references, calculate the highest standard deviation of returns from all the assets (1 pt.). 139 140 141 In cell G23, type either S&P 500. Small Stocks, Corp Bonds, World Portfolio or Treasury Bills depending on which asset has the highest standard deviation of returns (1 pt.). In cell E24. by using the MAX function and cell references, calculate the highest average return from all the assets (1 pt.). 19 In cell G24, type either S&P 500. Small Stocks, Corp Bonds, World Portfolio or Treasury Bills depending on which asset has the highest average return (1 pt.). 142 In cell 125, type either Yes or No depending on whether the asset with the highest average return also have the highest variance of returns. 113 1111 Q & A Search Edita Greate Share 1988 1989 1990 1991 1992 1993 1994 1995 1996 1997 1998 1999 2000 2001 2002 2003 2004 2005 2006 2007 2008 2009 2010 2011 2012 2013 2014 2015 0.166084 0.316862 -0.031043 0.304659 0.076194 0.100787 0.013205 0.375778 0.229603 0.333633 0.285786 0.210415 -0.091044 -0.118858 -0.221005 0.286846 0.108820 0.049114 0.157950 0.054937 -0.369976 0.264635 0.150640 0.021118 0.160032 0.323885 0.136884 0.013838 0.202876 0.014882 -0.363252 0.417989 0.220748 0.137919 -0.010961 0.200561 0.215107 0.320803 -0.119749 -0.012600 -0.024901 0.327806 -0.056243 0.691508 0.313921 0.039876 0.263790 -0.111001 -0.458645 1.121272 0.336100 -0.071553 0.213115 0.508143 -0.045410 -0.231836 0.137929 0.153096 0.086061 0.158685 0.106420 0.146619 -0.024347 0.219912 0.042387 0.108472 0.109077 -0.030366 0.116935 0.114614 0.111815 0.092294 0.065101 0.077340 0.041671 0.047424 0.134495 0.000180 0.079724 0.147028 0.045135 -0.030670 0.116575 0.012582 0.239504 0.171936 -0.165171 0.189665 -0.046597 0.231287 0.055836 0.213178 0.139931 0.162270 0.247953 0.253544 -0.129282 -0.165210 -0.195412 0.337610 0.152466 0.100233 0.206522 0.095660 -0.403341 0.307927 0.123385 -0.050167 0.165374 0.273649 0.055036 0.004941 H 0.063228 0.082206 0.076800 0.055065 0.034015 0.028993 0.038800 0.055318 0.051450 0.050819 0.047812 0.045609 0.057560 0.037787 0.016340 0.010183 0.012004 0.029633 0.047856 0.046748 0.014743 0.000967 0.001215 0.000428 0.000565 0.000277 0.000165 0.000092 0.044199 0.046561 0.061004 0.030813 0.028968 0.027553 0.026523 0.025554 0.033223 0.016881 0.016074 0.026971 0.033838 0.015633 0.023569 0.018797 0.032749 0.034167 0.025265 0.040859 0.001012 0.027087 0.014958 0.029668 0.017326 0.015180 0.007476 0.007240
Step by Step Solution
There are 3 Steps involved in it
Step: 1

Get Instant Access to Expert-Tailored Solutions
See step-by-step solutions with expert insights and AI powered tools for academic success
Step: 2

Step: 3
Ace Your Homework with AI
Get the answers you need in no time with our AI-driven, step-by-step assistance
Get Started
International Financial Management
Authors: Cheol S. Eun, Bruce G.Resnick
6th Edition
71316973, 978-0071316972, 78034655, 978-0078034657