Please I need help on this question ASAP, I edit it.


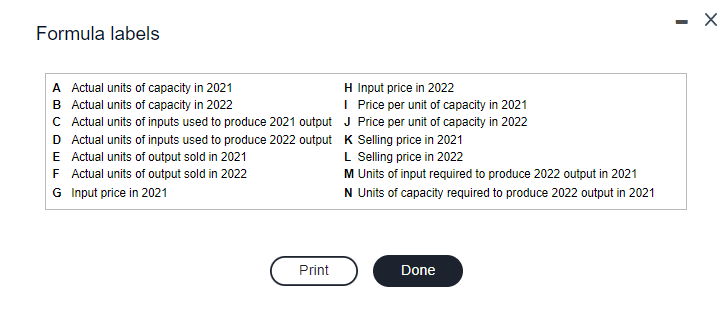
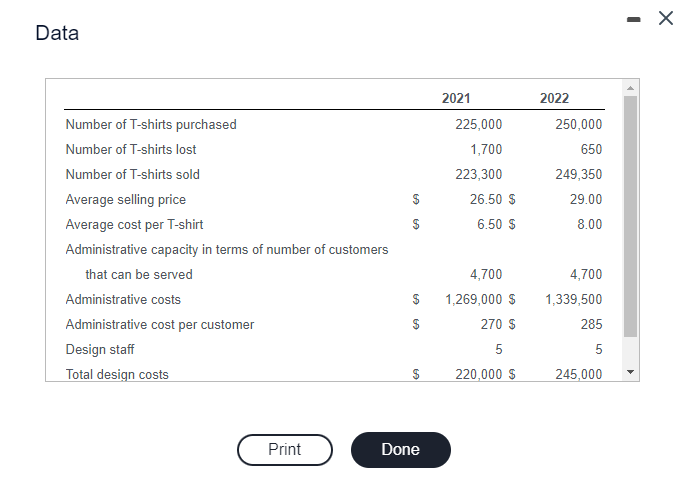
Formula labels A Actual units of capacity in 2021 H Input price in 2022 B Actual units of capacity in 2022 Price per unit of capacity in 2021 C Actual units of inputs used to produce 2021 output J Price per unit of capacity in 2022 D Actual units of inputs used to produce 2022 output K Selling price in 2021 E Actual units of output sold in 2021 L Selling price in 2022 F Actual units of output sold in 2022 M Units of input required to produce 2022 output in 2021 G Input price in 2021 N Units of capacity required to produce 2022 output in 2021 Print Done Rip Tide T-Shirt Company sells a variety of T-shirts. Rip Tide presents the following data for its first two years of operations, 2021 and 2022. For simplicity, assume that all purchasing and selling costs are included in the average cost per T-shirt and that each customer buys one T-shirt. E (Click the icon to view the data.) Required 1. Calculate Rip Tide's operating income in both 2021 and 2022. 2. Calculate the growth, price-recovery, and productivity components that explain the change in operating income from 2021 to 2022. 3. Comment on your answer in requirement 2. What does each of these components indicate? - 1 Data 2021 225,000 1,700 223,300 26.50 $ 6.50 $ 2022 250,000 650 249,350 29.00 8.00 $ $ Number of T-shirts purchased Number of T-shirts lost Number of T-shirts sold Average selling price Average cost per T-shirt Administrative capacity in terms of number of customers that can be served Administrative costs Administrative cost per customer Design staff Total design costs $ 4,700 1,339,500 285 GA 4,700 1,269,000 $ 270 $ 5 220,000 $ $ 5 $ 245,000 Print Done Requirement 1. Calculate Rip Tide's operating income in both 2021 and 2022. (Use parentheses or a minus sign for an operating loss.) 2021 2022 Revenue Costs T-shirts purchased Administrative costs Design costs Total costs Operating income Requirement 2. Calculate the growth, price-recovery, and productivity components that explain the change in operating income from 2021 to 2022. Use the popup to identify the various components of the formulas. (Click the icon to view the components to use for the formula labels.) Begin by determining the formula to calculate the revenue effect of growth. Then, enter the amounts in the formula. ( Revenue effect of growth ( ) Next, determine the formula to calculate the cost effect of growth for variable costs. Then, enter the amounts in the formula. Based upon the information provided to you, determine which cost is variable. (Hold all decimals in interim calculations. Round the cost effect to the nearest whole dollar.) ) x = Cost effect of growth for variable costs ( ) Determine the formula to calculate the cost effect of growth for fixed costs. Then, enter the amounts in the formula. Calculate the cost effect of growth for administrative costs first and then for design costs. (If any of the amounts to be entered are zero, please enter "0") ) x = Cost effect of growth for fixed costs ( x administrative costs ( ) design costs Calculate the net change in operating income due to the growth component. Be sure to label each component as to whether the amount has a favourable effect or an unfavourable effect on operating income. (Label each component as favourable (F) or unfavourable (U).) Revenue effect of growth Cost effect of growth Change in operating income due to growth Calculate the price-recovery component of the change in operating income. Begin with the revenue effect of price-recovery. Select the formula you will need, and then enter the amounts to calculate the revenue effect of price-recovery. x Revenue effect of price recovery ( ) Next, determine the formula to calculate the cost effect of price-recovery for variable costs. Then, enter the amounts in the formula. Think, based upon the information provided to you, about which cost is variable. (Round your final answer to the nearest whole dollar.) 1 x Cost effect of price recovery for variable costs Determine the formula to calculate the cost effect of price-recovery for fixed costs. Then, enter the amounts in the formula. Calculate the cost effect of price-recovery for administrative costs first and then for design costs. ) Cost effect of price recovery for fixed costs Administrative costs ( ) x X Design costs Calculate the net change in operating income due to the price-recovery component. Be sure to label each component as to whether the amount has a favourable effect or an unfavourable effect on operating income. (Label each component as favourable (F) or unfavourable (U).) Revenue effect of price-recovery Cost effect of price-recovery Change in operating income due to price-recovery Calculate the productivity component of the change in operating income. Begin with the cost effect of productivity for variable costs. Select the formula you will need, and then enter the amounts to calculate the revenue effect of productivity. Cost effect of productivity for variable costs ( ) Determine the formula to calculate the cost effect of productivity for fixed costs. Then, enter the amounts in the formula. Calculate the cost effect of productivity for administrative costs first and then for design costs. (If any of the amounts to be entered are zero, please enter "0".) ) X ( ) x Cost effect of productivity for fixed costs Administrative costs Design costs ) x Calculate the net change in operating income due to the productivity component. Be sure to label each component as to whether the amount has a favourable effect or an unfavourable effect on operating income. (If there is no effect, enter a zero and leave the dropdown blank. If there is an effect, label the component as favourable (F) or unfavourable (U).) Change in operating income due to productivity Requirement 3. Comment on your answer in requirement 2. What does each of these components indicate? v in operating income resulted from Rip Tide's leadership strategy. The company was able to continue to while growing sales. The analysis of operating income indicates that a significant amount of the Rip Tide was Formula labels A Actual units of capacity in 2021 H Input price in 2022 B Actual units of capacity in 2022 Price per unit of capacity in 2021 C Actual units of inputs used to produce 2021 output J Price per unit of capacity in 2022 D Actual units of inputs used to produce 2022 output K Selling price in 2021 E Actual units of output sold in 2021 L Selling price in 2022 F Actual units of output sold in 2022 M Units of input required to produce 2022 output in 2021 G Input price in 2021 N Units of capacity required to produce 2022 output in 2021 Print Done Rip Tide T-Shirt Company sells a variety of T-shirts. Rip Tide presents the following data for its first two years of operations, 2021 and 2022. For simplicity, assume that all purchasing and selling costs are included in the average cost per T-shirt and that each customer buys one T-shirt. E (Click the icon to view the data.) Required 1. Calculate Rip Tide's operating income in both 2021 and 2022. 2. Calculate the growth, price-recovery, and productivity components that explain the change in operating income from 2021 to 2022. 3. Comment on your answer in requirement 2. What does each of these components indicate? - 1 Data 2021 225,000 1,700 223,300 26.50 $ 6.50 $ 2022 250,000 650 249,350 29.00 8.00 $ $ Number of T-shirts purchased Number of T-shirts lost Number of T-shirts sold Average selling price Average cost per T-shirt Administrative capacity in terms of number of customers that can be served Administrative costs Administrative cost per customer Design staff Total design costs $ 4,700 1,339,500 285 GA 4,700 1,269,000 $ 270 $ 5 220,000 $ $ 5 $ 245,000 Print Done Requirement 1. Calculate Rip Tide's operating income in both 2021 and 2022. (Use parentheses or a minus sign for an operating loss.) 2021 2022 Revenue Costs T-shirts purchased Administrative costs Design costs Total costs Operating income Requirement 2. Calculate the growth, price-recovery, and productivity components that explain the change in operating income from 2021 to 2022. Use the popup to identify the various components of the formulas. (Click the icon to view the components to use for the formula labels.) Begin by determining the formula to calculate the revenue effect of growth. Then, enter the amounts in the formula. ( Revenue effect of growth ( ) Next, determine the formula to calculate the cost effect of growth for variable costs. Then, enter the amounts in the formula. Based upon the information provided to you, determine which cost is variable. (Hold all decimals in interim calculations. Round the cost effect to the nearest whole dollar.) ) x = Cost effect of growth for variable costs ( ) Determine the formula to calculate the cost effect of growth for fixed costs. Then, enter the amounts in the formula. Calculate the cost effect of growth for administrative costs first and then for design costs. (If any of the amounts to be entered are zero, please enter "0") ) x = Cost effect of growth for fixed costs ( x administrative costs ( ) design costs Calculate the net change in operating income due to the growth component. Be sure to label each component as to whether the amount has a favourable effect or an unfavourable effect on operating income. (Label each component as favourable (F) or unfavourable (U).) Revenue effect of growth Cost effect of growth Change in operating income due to growth Calculate the price-recovery component of the change in operating income. Begin with the revenue effect of price-recovery. Select the formula you will need, and then enter the amounts to calculate the revenue effect of price-recovery. x Revenue effect of price recovery ( ) Next, determine the formula to calculate the cost effect of price-recovery for variable costs. Then, enter the amounts in the formula. Think, based upon the information provided to you, about which cost is variable. (Round your final answer to the nearest whole dollar.) 1 x Cost effect of price recovery for variable costs Determine the formula to calculate the cost effect of price-recovery for fixed costs. Then, enter the amounts in the formula. Calculate the cost effect of price-recovery for administrative costs first and then for design costs. ) Cost effect of price recovery for fixed costs Administrative costs ( ) x X Design costs Calculate the net change in operating income due to the price-recovery component. Be sure to label each component as to whether the amount has a favourable effect or an unfavourable effect on operating income. (Label each component as favourable (F) or unfavourable (U).) Revenue effect of price-recovery Cost effect of price-recovery Change in operating income due to price-recovery Calculate the productivity component of the change in operating income. Begin with the cost effect of productivity for variable costs. Select the formula you will need, and then enter the amounts to calculate the revenue effect of productivity. Cost effect of productivity for variable costs ( ) Determine the formula to calculate the cost effect of productivity for fixed costs. Then, enter the amounts in the formula. Calculate the cost effect of productivity for administrative costs first and then for design costs. (If any of the amounts to be entered are zero, please enter "0".) ) X ( ) x Cost effect of productivity for fixed costs Administrative costs Design costs ) x Calculate the net change in operating income due to the productivity component. Be sure to label each component as to whether the amount has a favourable effect or an unfavourable effect on operating income. (If there is no effect, enter a zero and leave the dropdown blank. If there is an effect, label the component as favourable (F) or unfavourable (U).) Change in operating income due to productivity Requirement 3. Comment on your answer in requirement 2. What does each of these components indicate? v in operating income resulted from Rip Tide's leadership strategy. The company was able to continue to while growing sales. The analysis of operating income indicates that a significant amount of the Rip Tide was


