Please I need help with 18,24,28,30 and
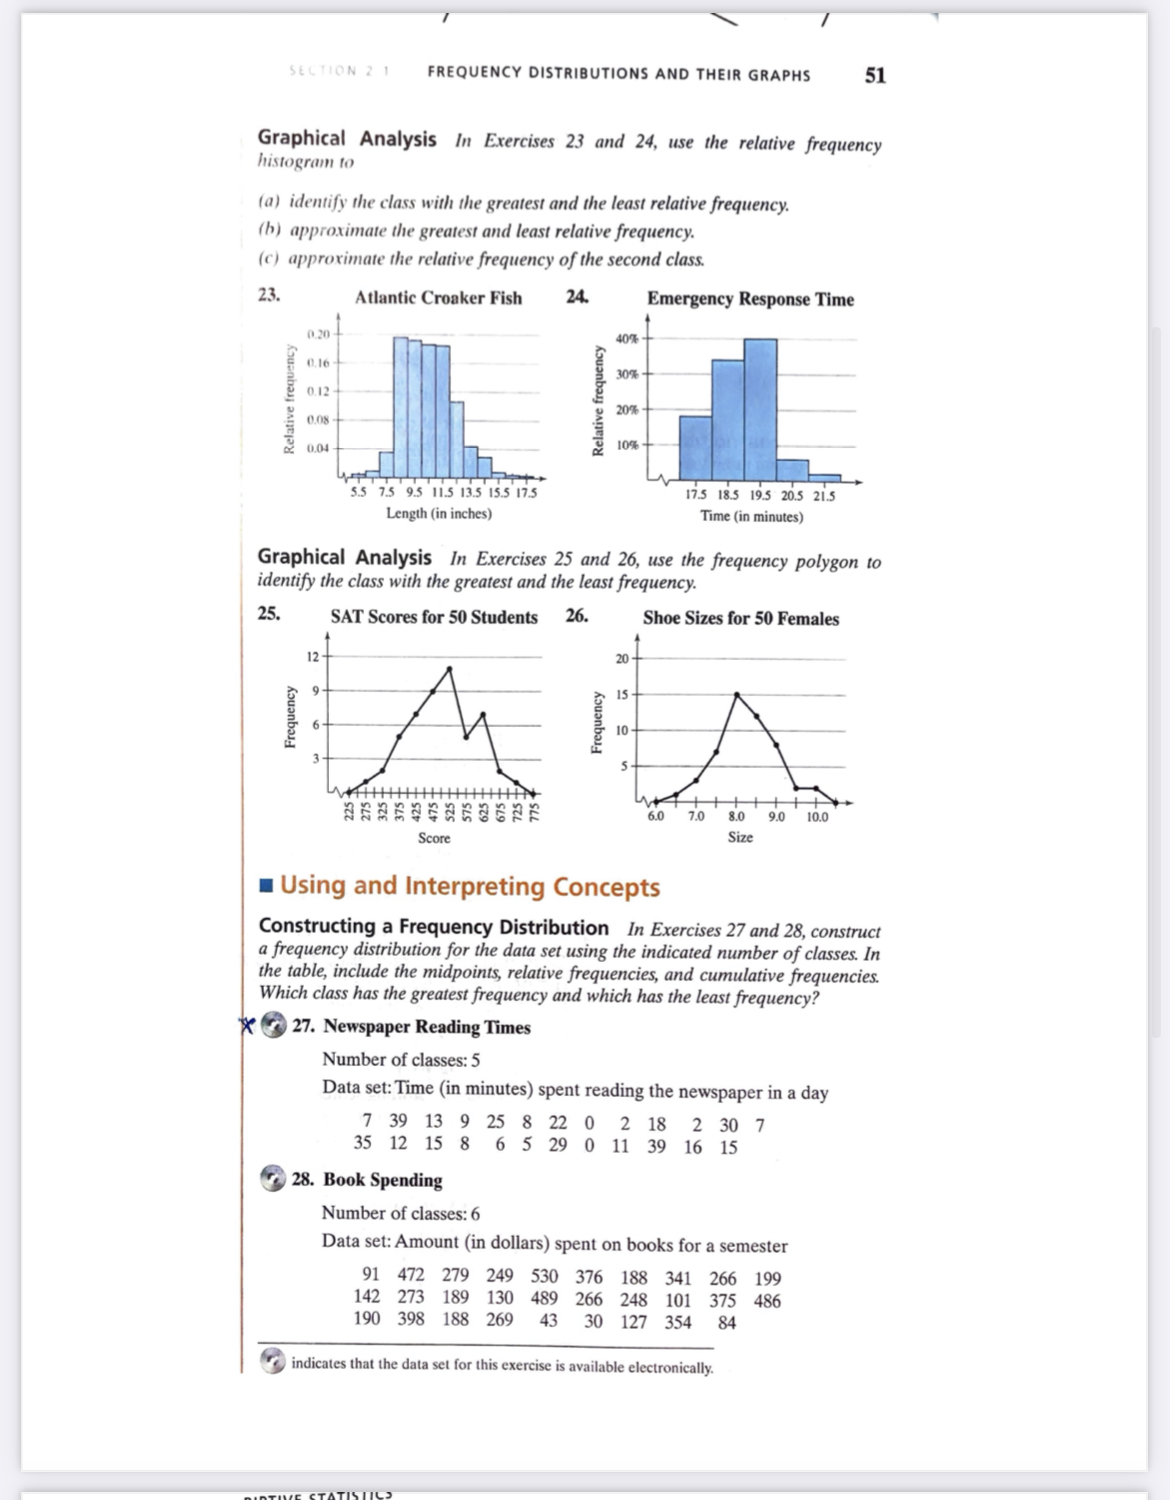
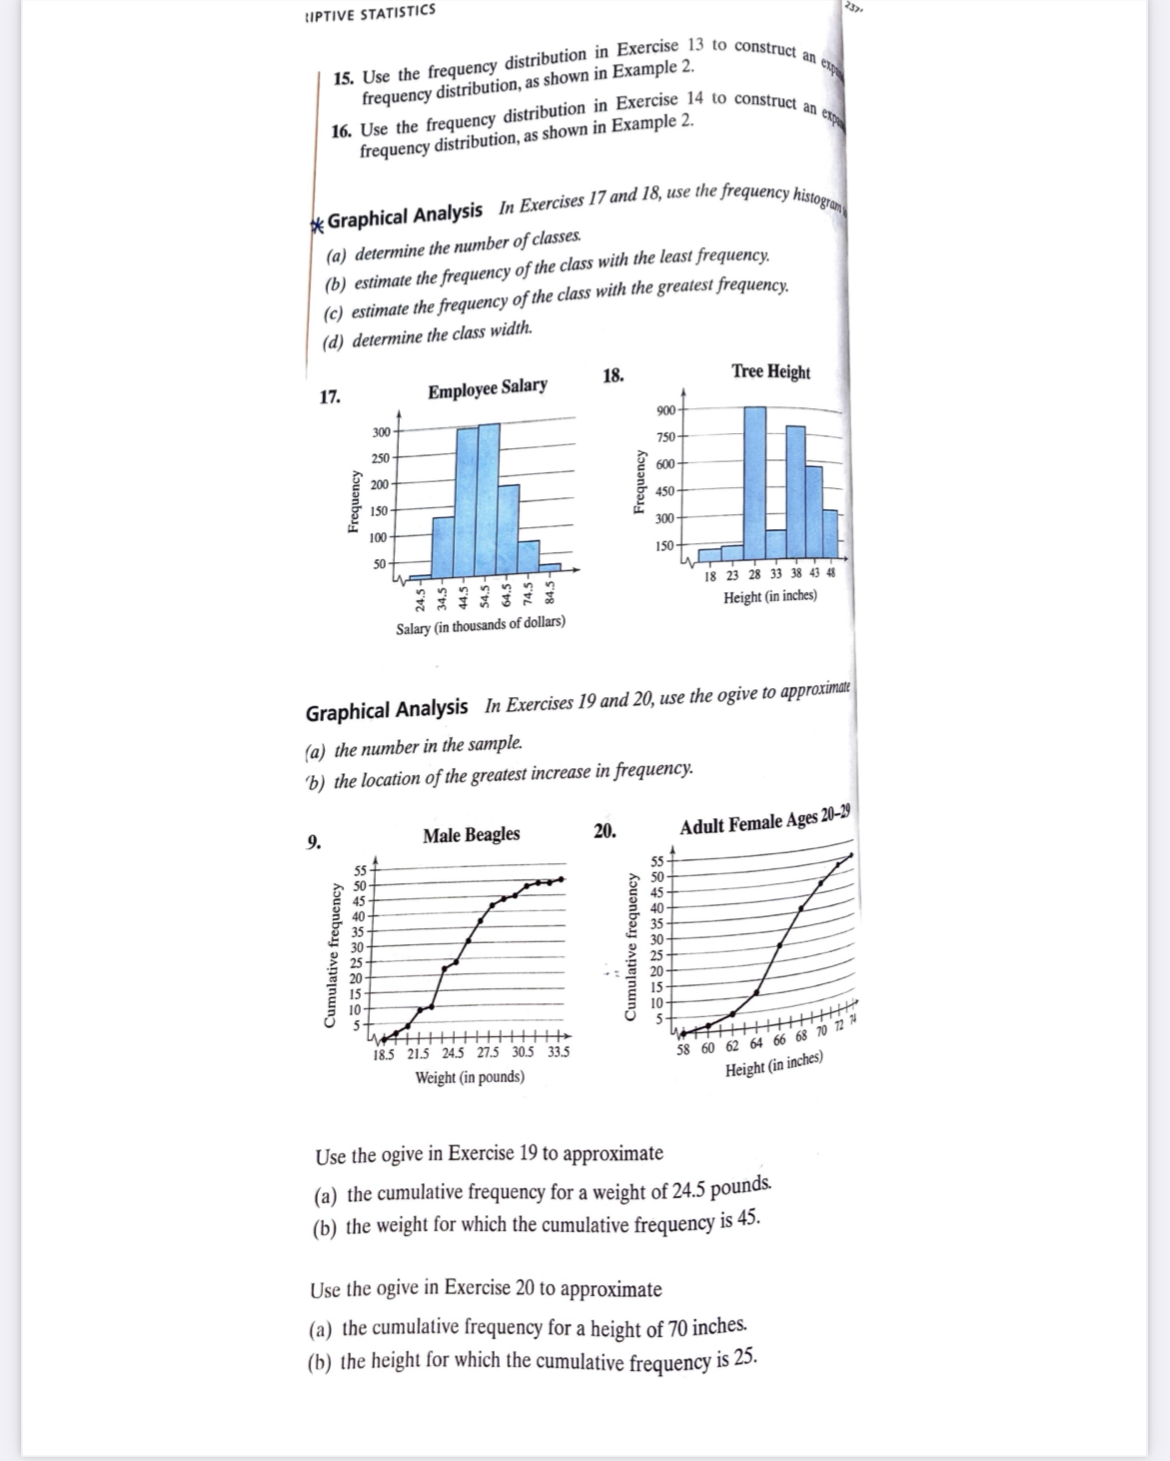
SECTION 2. 1 FREQUENCY DISTRIBUTIONS AND THEIR GRAPHS 53 35. Plant Heights Data set: Heights (in inches) of a sample of tomato plants 40 44 35 49 35 43 35 36 3 37 41 41 48 52 37 40 36 35 50 42 51 33 34 51 39 36. Years of Service Data set: Years of service of a sample of New York state troopers 12 7 9 8 9 12 10 S 10 6 8 3 12 10 11 7 14 12 9 8 10 9 11 13 8 Constructing a Cumulative Frequency Distribution and an Ogive In Exercises 37-40, construct a cumulative frequency distribution and an ogive for the data set using six classes. Then describe the location of the greatest increase in frequency. * 37. Retirement Ages Data set: Retirement ages for a sample of doctors 70 54 55 71 57 58 63 65 60 66 57 62 63 60 63 60 66 60 67 69 69 52 61 73 38. Saturated Fat Intakes Data set: Daily saturated fat intakes (in grams) of a sample of people 38 32 34 39 40 54 32 17 2 33 57 40 25 5 36 33 24 42 16 31 33 39. Gasoline Purchases Data set: Gasoline (in gallons) purchased by a sample of drivers during one fill-up 18 8 8 6 2 9 12 4 14 15 10 3 11 4 4 9 12 5 40. Cellular Phone Calls Data set: Lengths (in minutes) of a sample of cellular phone calls 1 20 10 20 13 23 3 7 18 7 4 5 15 7 29 10 18 10 10 23 4 12 8 6 Constructing a Frequency Distribution and a Frequency Polygon In Exercises 41 and 42, construct a frequency distribution and a frequency polygon for the data set. Describe any patterns. 41. Exam Scores Number of classes: 5 Data set: Exam scores for all students in a statistics class 83 92 94 82 73 98 78 85 72 90 89 92 96 89 75 85 63 47 75 82SECTION 2 1 FREQUENCY DISTRIBUTIONS AND THEIR GRAPHS 51 Graphical Analysis In Exercises 23 and 24, use the relative frequency histogram to (a) identify the class with the greatest and the least relative frequency. (b) approximate the greatest and least relative frequency. (c) approximate the relative frequency of the second class. 23. Atlantic Croaker Fish 24. Emergency Response Time 0.20 40% 0.16 30% 0.12 Relative frequency Relative frequency 20% 0.08 0.04 10% 5.5 7.5 9.5 11.5 13.5 15.5 17.5 17.5 18.5 19.5 20.5 21.5 Length (in inches) Time (in minutes) Graphical Analysis In Exercises 25 and 26, use the frequency polygon to identify the class with the greatest and the least frequency. 25. SAT Scores for 50 Students 26. Shoe Sizes for 50 Females 12 Frequency Frequency 6.0 7.0 8.0 9.0 10.0 Score Size Using and Interpreting Concepts Constructing a Frequency Distribution In Exercises 27 and 28, construct a frequency distribution for the data set using the indicated number of classes. In the table, include the midpoints, relative frequencies, and cumulative frequencies. Which class has the greatest frequency and which has the least frequency? x 27. Newspaper Reading Times Number of classes: 5 Data set: Time (in minutes) spent reading the newspaper in a day 39 13 25 8 22 0 2 18 2 30 7 12 15 8 6 5 29 0 11 39 16 15 28. Book Spending Number of classes: 6 Data set: Amount (in dollars) spent on books for a semester 91 279 249 530 376 188 341 266 199 142 273 189 130 489 266 2 6 248 101 375 486 190 398 188 269 43 30 127 354 84 indicates that the data set for this exercise is available electronically.LIPTIVE STATISTICS 15. Use the frequency distribution in Exercise 13 to construct an frequency distribution, as shown in Example 2. n expo 10. Use the frequency distribution in Exercise 14 to construct an ex frequency distribution, as shown in Example 2. * Graphical Analysis In Exercises 17 and 18, use the frequency histogram (a) determine the number of classes. (b) estimate the frequency of the class with the least frequency. (c) estimate the frequency of the class with the greatest frequency. (d) determine the class width. 17. Employee Salary 18. Tree Height 300- 900- 750- 250 200 600- Frequency Frequency 150 450- 300 150- 3232323 18 23 28 33 38 43 48 Height (in inches) Salary (in thousands of dollars) Graphical Analysis In Exercises 19 and 20, use the ogive to approximate (a) the number in the sample. 'b) the location of the greatest increase in frequency. 9. Male Beagles 20. Adult Female Ages 20-29 50- 35- Cumulative frequency Cumulative frequency 20 10- 18.5 21.5 24.5 27.5 30.5 33.5 58 60 62 64 66 68 70 72 74 Weight (in pounds) Height (in inches) Use the ogive in Exercise 19 to approximate (a) the cumulative frequency for a weight of 24.5 pounds. (b) the weight for which the cumulative frequency is 45. Use the ogive in Exercise 20 to approximate (a) the cumulative frequency for a height of 70 inches. (b) the height for which the cumulative frequency is 25.RIPTIVE STATISTICS Constructing a Frequency Distribution and a Frequency Histogram In Exercises 29-32, construct a frequency distribution and a frequency histo cy histogram for the data set using the indicated number of classes. Describe any patterns. 29. Sales Number of classes: 6 Data set: July sales (in dollars) for all sales representatives at a company 2114 2468 7119 1876 4105 3183 1932 1355 4278 1030 2000 1077 5835 1512 1697 2478 3981 1643 1858 1500 4608 1000 30. Pepper Pungencies Number of classes: 5 Data set: Pungencies (in 1000s of Scoville units) of 24 tabasco peppers 35 51 44 42 37 38 36 39 44 43 40 40 32 39 41 38 42 39 40 46 37 35 41 39 31. Reaction Times Number of classes: 8 Data set: Reaction times (in milliseconds) of a sample of 30 adult females to an auditory stimulus 507 389 305 291 336 310 514 442 307 337 373 428 387 454 323 441 3884 426 469 351 411 382 320 450 309 416 359 388 3 422 413 32. Fracture Times Number of classes: 5 Data set: Amount of pressure (in pounds per square inch) at fracture time for 25 samples of brick mortar 2750 2862 2885 2490 2512 2456 2554 2532 2885 2872 2601 2877 2721 2692 2888 2755 2853 2517 2867 2718 2641 2834 2466 2596 2519 Constructing a Frequency Distribution and a Relative Frequency Histogram In Exercises 33-36, construct a frequency distribution and a relative frequency histogram for the data set using five classes. Which class has the greatest relative frequency and which has the least relative frequency? 33. Bowling Scores Data set: Bowling scores of a sample of league members 154 257 195 220 182 240 177 228 235 146 174 192 165 207 180 264 169 225 239 148 190 182 205 148 188 34. ATM Withdrawals Data set: A sample of ATM withdrawals (in dollars) 35 10 30 25 75 10 30 20 20 10 40 50 40 30 60 70 25 4 40 10 60 20 80 40 25 20 10 20 25 30 50 80 2