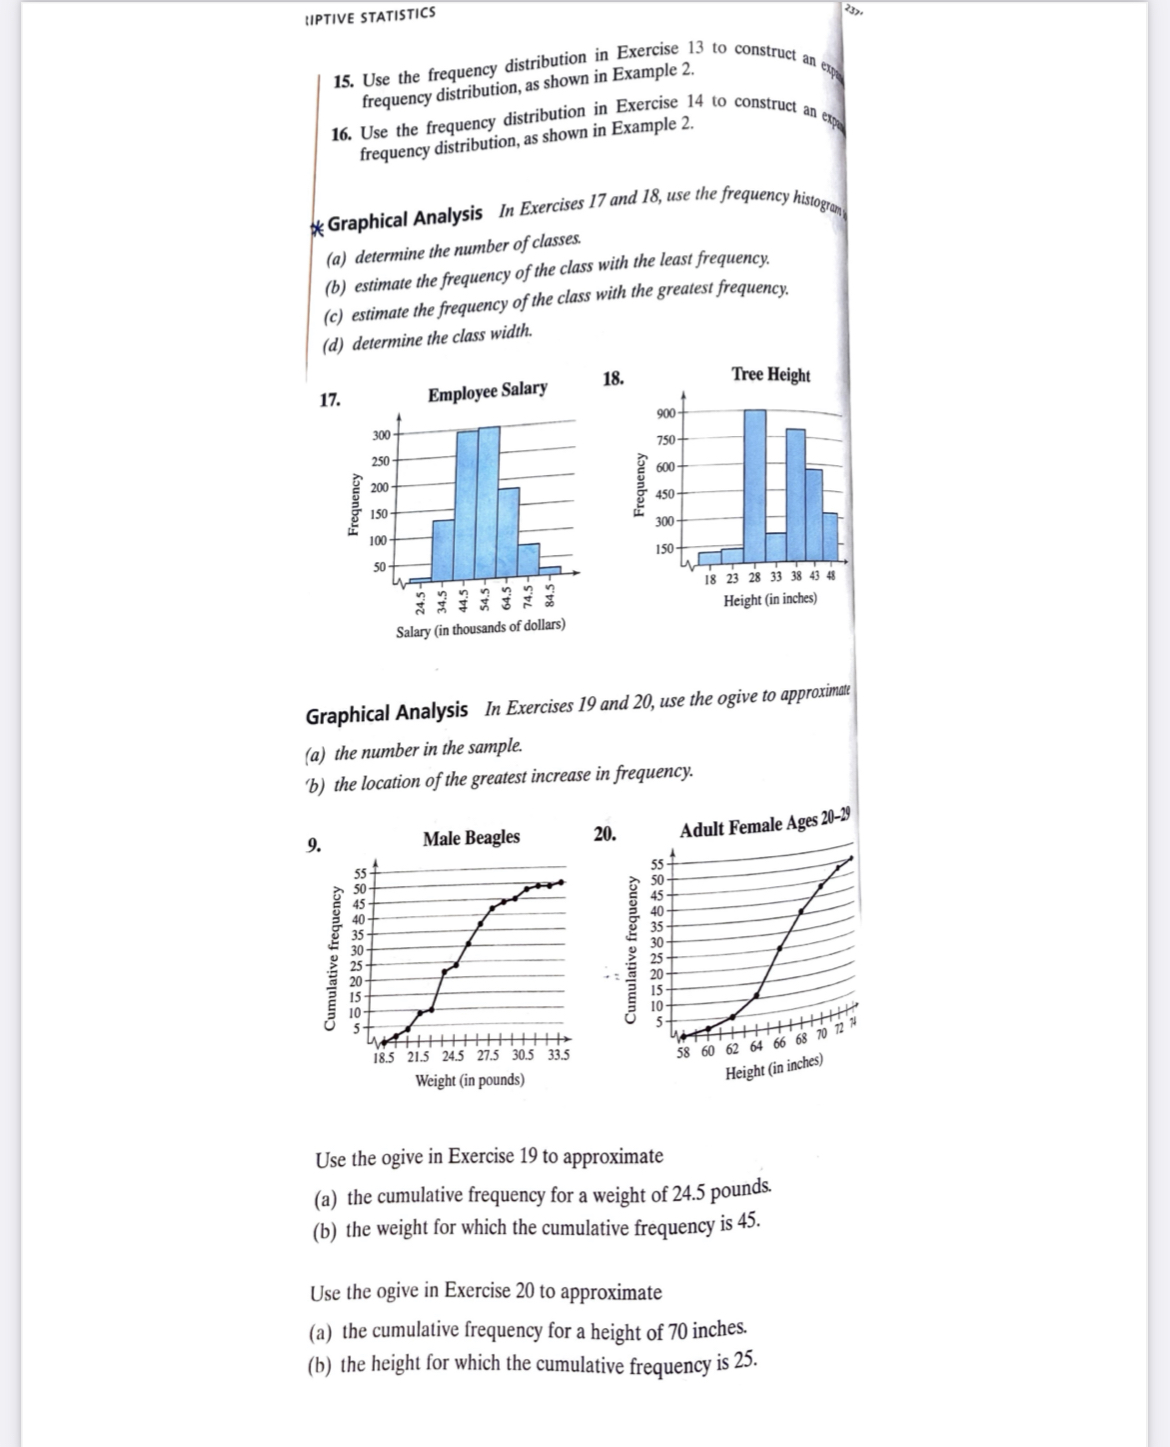
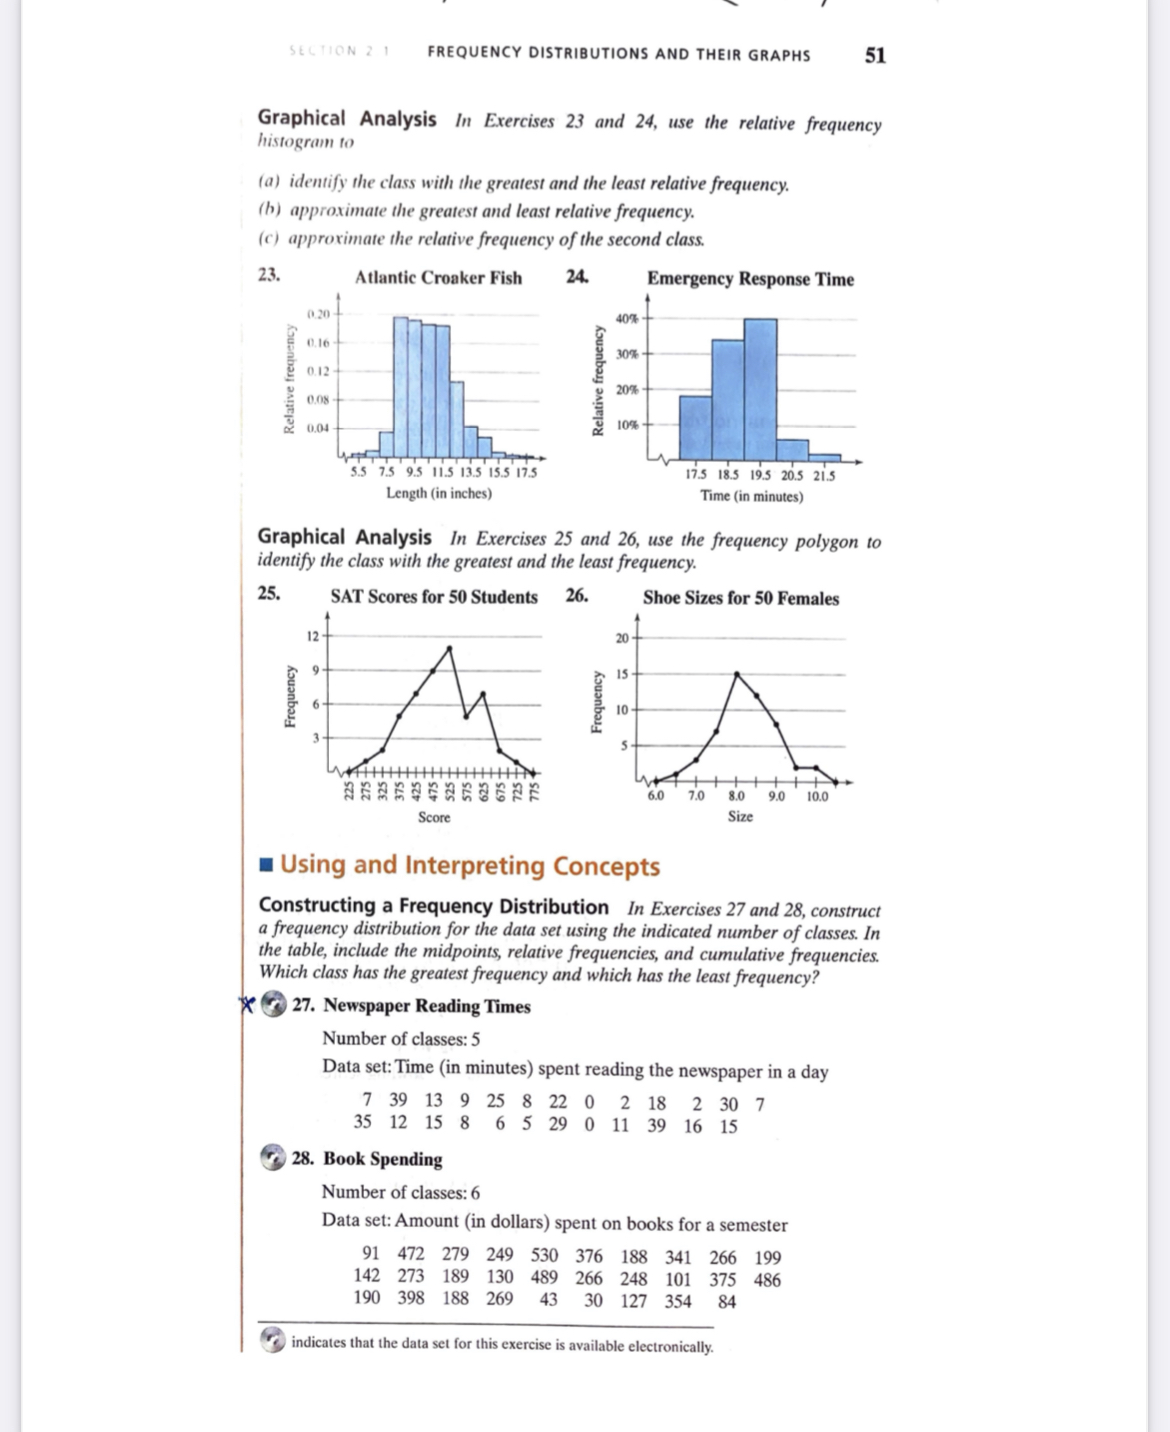
Please I need help with number 18, 24, and 28. What is the missing information?
LIPTIVE STATISTICS 15. Use the frequency distribution in Exercise 15 to construct an ex frequency distribution, as shown in Example 2. 16. Use the frequency distribution in Exercise 14 to construct an ex frequency distribution, as shown in Example 2. * Graphical Analysis In Exercises 17 and 18, use the frequency histogram (a) determine the number of classes. (b) estimate the frequency of the class with the least frequency. c) estimate the frequency of the class with the greatest frequency. d) determine the class width. 17. Employee Salary 18. Tree Height 900- 300- 750- 250 200 600- Frequency Frequency 150 450- 300- 150- 2372323 18 23 28 33 38 43 48 Height (in inches) Salary (in thousands of dollars) Graphical Analysis In Exercises 19 and 20, use the ogive to approximate (a) the number in the sample. 'b) the location of the greatest increase in frequency. 9 Male Beagles 20. Adult Female Ages 20-29 55- Cumulative frequency Cumulative frequency 10- 18.5 21.5 24.5 27.5 30.5 33.5 58 60 62 64 66 68 70 72 74 Weight (in pounds) Height (in inches) Use the ogive in Exercise 19 to approximate (a) the cumulative frequency for a weight of 24.5 pounds. (b) the weight for which the cumulative frequency is 45. Use the ogive in Exercise 20 to approximate (a) the cumulative frequency for a height of 70 inches. (b) the height for which the cumulative frequency is 25.SECTION 2 1 FREQUENCY DISTRIBUTIONS AND THEIR GRAPHS 51 Graphical Analysis In Exercises 23 and 24, use the relative frequency histogram to (a) identify the class with the greatest and the least relative frequency. (b) approximate the greatest and least relative frequency. (c) approximate the relative frequency of the second class. 23. Atlantic Croaker Fish 24. Emergency Response Time 0.20 40% 0.16 30% 0.12 Relative frequency Relative frequent 0.08 105% 5.5 7.5 9.5 11.5 13.5 15.5 17.5 17.5 18.5 19.5 20.5 21.5 Length (in inches) Time (in minutes) Graphical Analysis In Exercises 25 and 26, use the frequency polygon to identify the class with the greatest and the least frequency. 25. SAT Scores for 50 Students 26. Shoe Sizes for 50 Females 12 - 15 Frequency Frequency 3- 6.0 7.0 8.0 0 10.0 Score Size Using and Interpreting Concepts Constructing a Frequency Distribution In Exercises 27 and 28, construct a frequency distribution for the data set using the indicated number of classes. In the table, include the midpoints, relative frequencies, and cumulative frequencies. Which class has the greatest frequency and which has the least frequency? * 27. Newspaper Reading Times Number of classes: 5 Data set: Time (in minutes) spent reading the newspaper in a day 7 39 13 9 25 8 22 0 2 18 2 30 7 35 12 15 8 6 5 29 0 11 39 16 15 28. Book Spending Number of classes: 6 Data set: Amount (in dollars) spent on books for a semester 91 472 279 249 530 376 188 341 266 199 142 273 189 130 489 266 248 101 375 486 190 398 188 269 43 30 127 354 84 indicates that the data set for this exercise is available electronically


