PLEASE, I NEED HELP WITH PART C ONLY. THANK YOU.


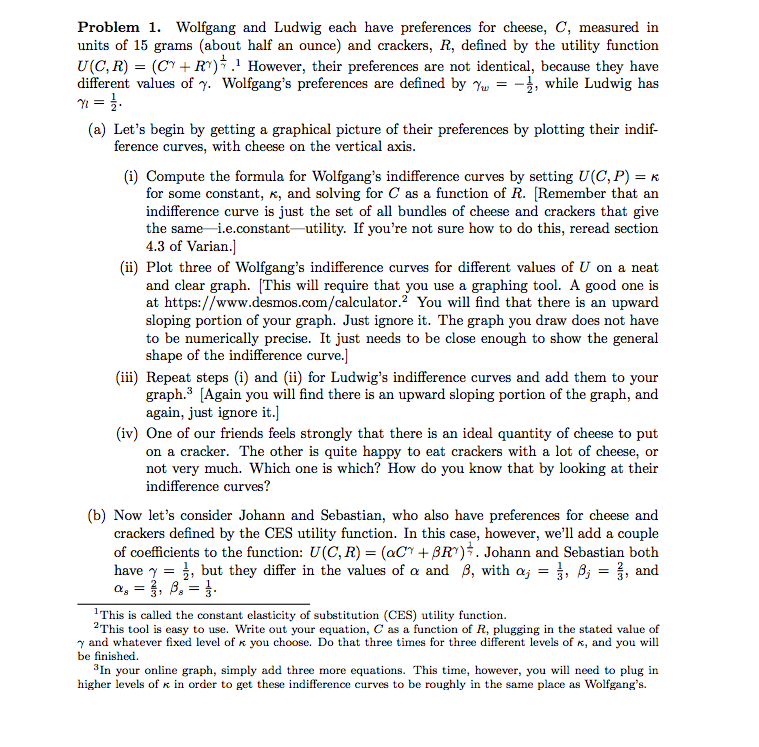
Problem 1. Wolfgang and Ludwig each have preferences for cheese, C, measured in units of 15 grams (about half an ounce) and crackers, R, defined by the utility function U(C,R) YR) However, their preferences are not identical, because they have different values of y. Wolfgang's preferences are defined by u2, while Ludwig has (a) Let's begin by getting a graphical picture of their preferences by plotting their indif- ference curves, with cheese on the vertical axis (i) Compute the formula for Wolfgang's indifference curves by setting U(C, P)K for some constant, , and solving for C as a function of R. [Remember that an indifference curve is just the set of all bundles of cheese and crackers that give the same-i.e.constantutility. If you're not sure how to do this, reread section 4.3 of Varian.] (ii) Plot three of Wolfgang's indifference curves for different values of U on a neat and clear graph. [This will require that you use a graphing tool. A good one is at https://www.desmos.com/calculator.2 You wil find that there is an upward sloping portion of your graph. Just ignore it. The graph you draw does not have to be numerically precise. It just needs to be close enough to show the general shape of the indifference curve.] (iii) Repeat steps (i) and (ii) for Ludwig's indifference curves and add them to your graph.3 [Again you will find there is an upward sloping portion of the graph, and again, just ignore it.] (iv) One of our friends feels strongly that there is an ideal quantity of cheese to put on a cracker. The other is quite happy to eat crackers with a lot of cheese, or not very much. Which one is which? How do you know that by looking at their indifference curves? (b) Now let's consider Johann and Sebastian, who also have preferences for cheese and crackers defined by the CES utility function. In this case, however, we'll add a couple of coefficients to the function: U(C, R)-(aCBR)7. Johann and Sebastian both have - , but they differ in the values of and , with ,-, - , and 1This is called the constant elasticity of substitution (CES) utility function. 2This tool is easy to use. Write out your equation, C as a function of R, plugging in the stated value of and whatever fixed level of you choose. Do that three times for three different levels of K, and you will be finished In your online graph, simply add three more equations. This time, however, you wi need to plug in higher levels of in order to get these i curves to be roughly in the same place as Wolfga S


