

Question
Please i would need detailed explanation on below The purpose of this assignment is to apply data distributions to discrete and continuous data and justify
Please i would need detailed explanation on below
The purpose of this assignment is to apply data distributions to discrete and continuous data and justify the selection of the distributions.
You will use SPSS to analyze the data set and address the questions presented.
Part 1:
Identify if the following random variables are discrete or continuous.
- Number of defected items in a shipment.
- Height of males (in mm) who attend Grand Canyon University.
- Yearly income among all people in the United States.
- Whether or not a high school graduate is accepted into a college.
- Time that it takes for a person to run a mile.
- The number of emergency hospital visits that each person had in the last 12 months.
Part 2:
LetXbe a random variable of the outcome after rolling a six-sided die that isnotfair. In fact, the die is designed to never result in a 1 or 6, while the other outcomes (i.e., 2, 3, 4, and 5) are equally probable.
- What is the PMF ofX?
- What is the CDF ofX?
- What is = ?
- What is = ?
- What is = ?
Part 3:
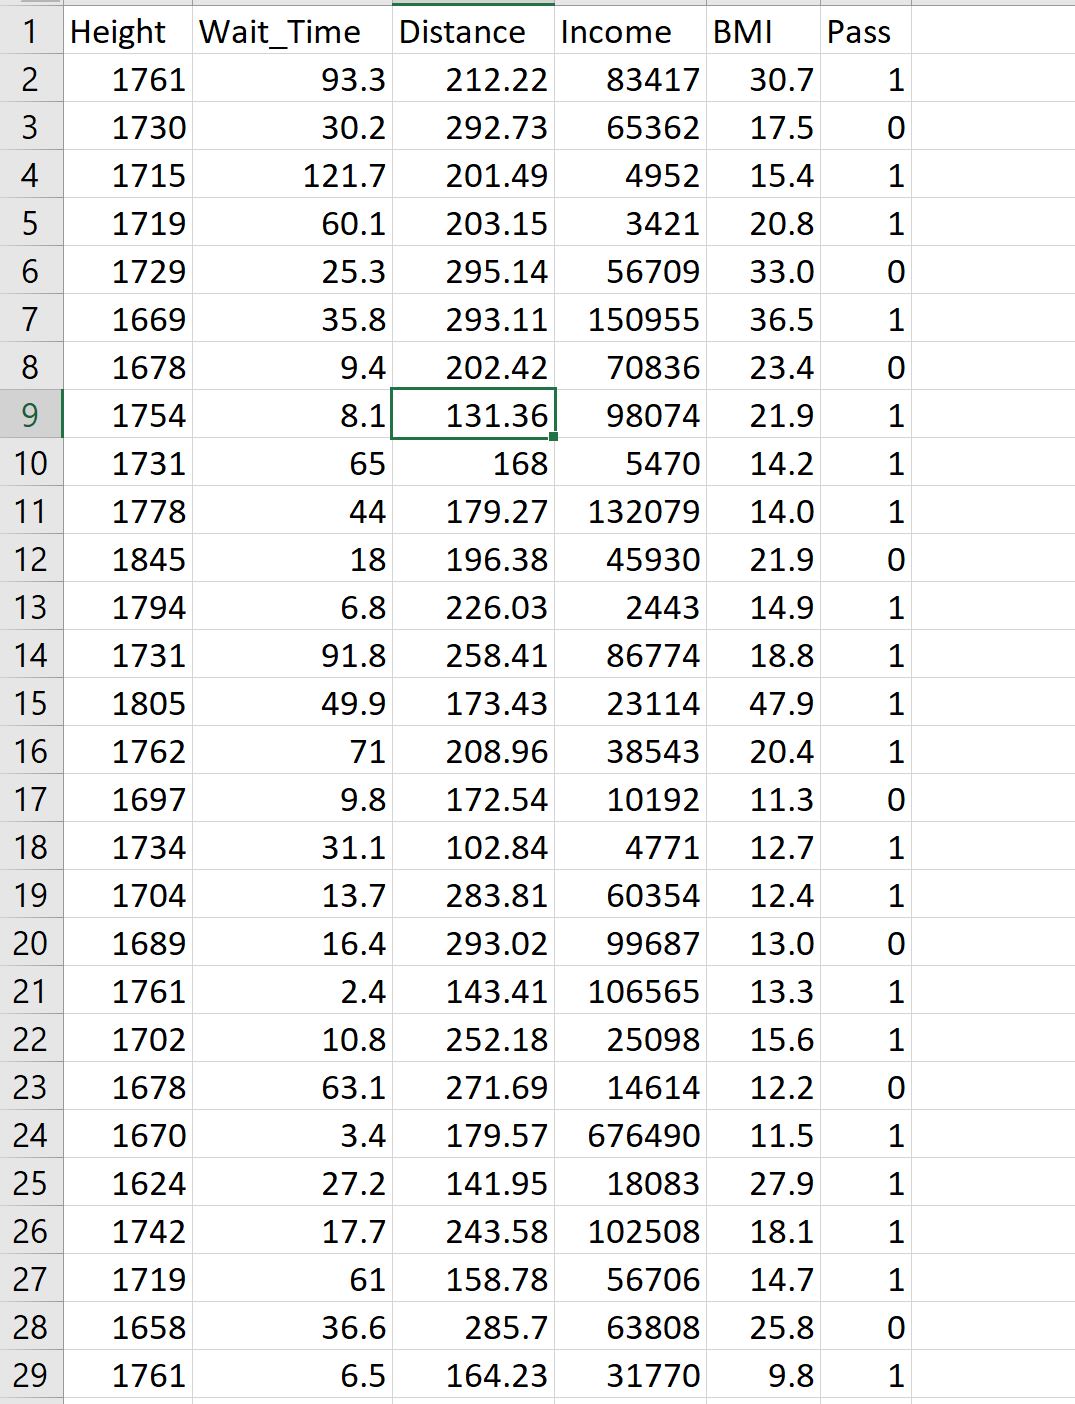
The data set provided consists of the following random variables:
- BMI:The body mass index of a random set of people.
- Distance:The distance (in feet) that a baseball player hit the ball.
- Height:The height of males (in mm).
- Income:The income (in dollars) of people in a large company.
- Pass:The outcome when taking an exam (1=Pass; 0=Fail).
- Wait Time:The time (in minutes) that it takes when waiting for the train.
Answer each question below. Use SPSS as needed and include the software outputs as part of the Word document you submit.
- What is a Q-Q plot?
- Given a set of realized values of a random variable, how can a Q-Q plot be used to assess the distribution of the random variable?
- Using histograms and Q-Q plots (except for binomial), match each random variable to one of the following distributions: Binomial (with N=1, P=0.7), Chi-square (with d.f.=20), Exponential, Lognormal, Normal, and Uniform.
Step by Step Solution
There are 3 Steps involved in it
Step: 1

Get Instant Access to Expert-Tailored Solutions
See step-by-step solutions with expert insights and AI powered tools for academic success
Step: 2

Step: 3
Ace Your Homework with AI
Get the answers you need in no time with our AI-driven, step-by-step assistance
Get Started
Calculus An Applied Approach
Authors: Ron Larson, Dennis J McKenzie, Larson/Edwards, Bruce H Edwards
7th Edition
1111809720, 9781111809720