

Answered step by step
Verified Expert Solution
Question
1 Approved Answer
please if you can help me from where the professor got this values that are in circle specifically TABLE B.1 Market Analysis 2019 2020 2021
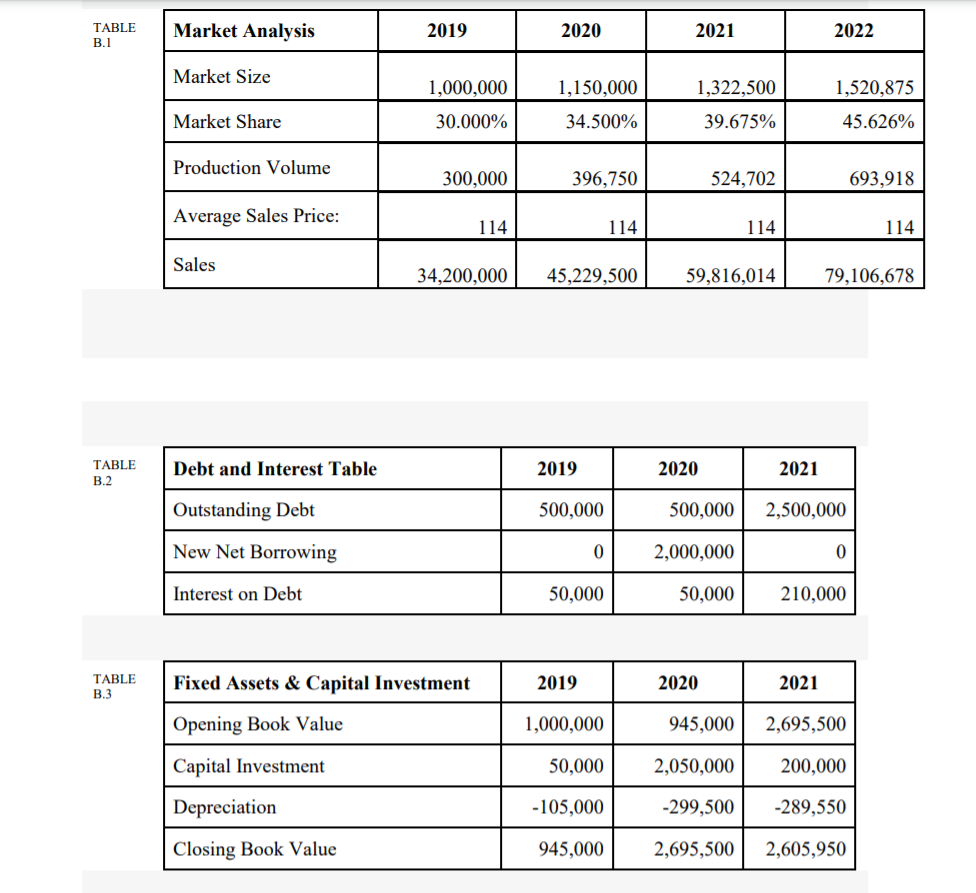
please if you can help me from where the professor got this values that are in circle specifically
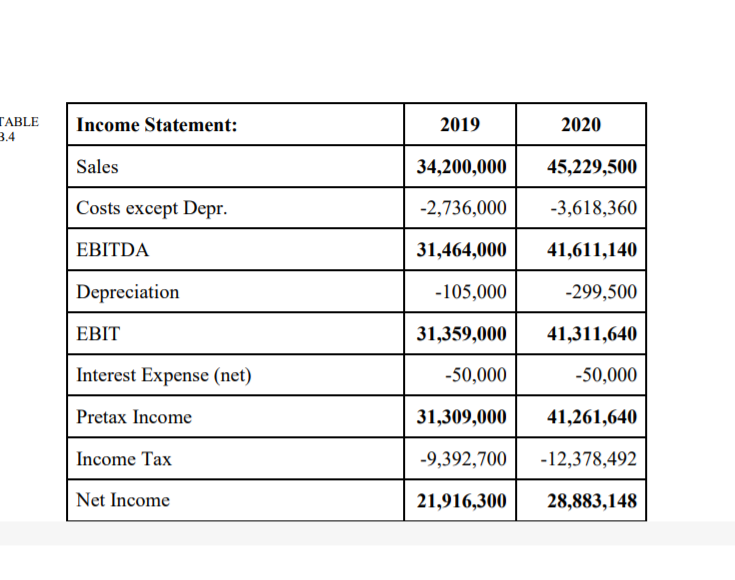
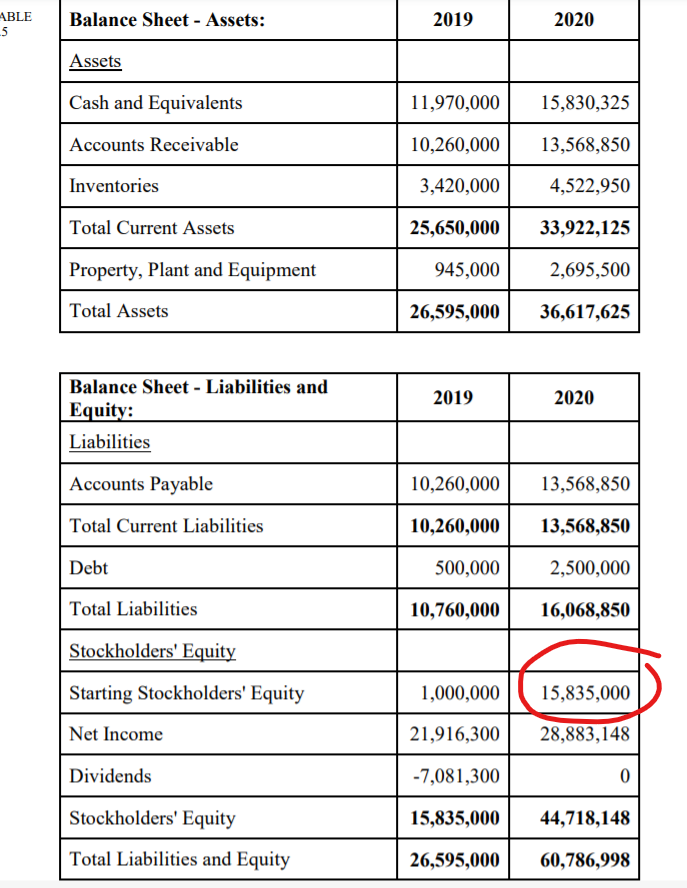
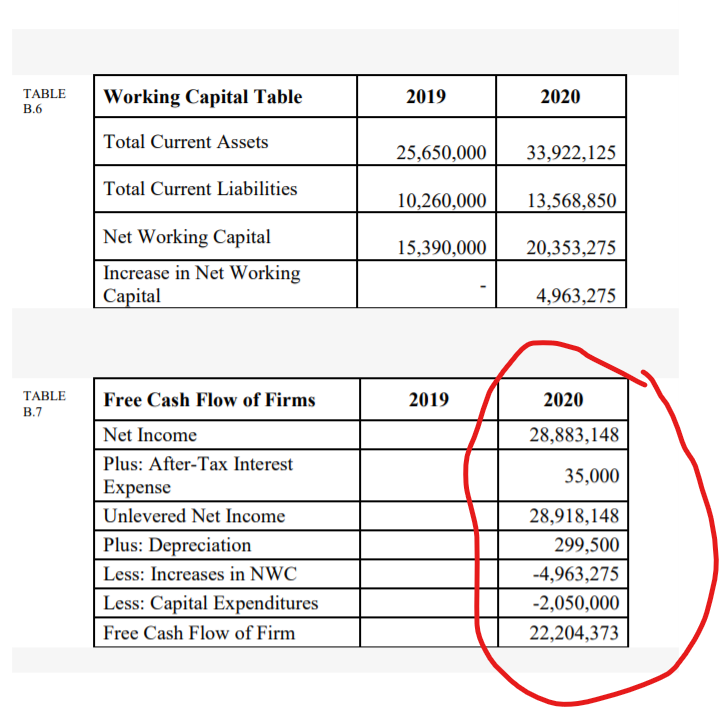
TABLE B.1 Market Analysis 2019 2020 2021 2022 Market Size 1,000,000 30.000% 1,150,000 34.500% 1,322,500 39.675% 1,520,875 45.626% Market Share Production Volume 300,000 396,750 524,702 693,918 Average Sales Price: 114 114 114 114 Sales 34,200,000 45,229,500 59,816,014 79,106,678 TABLE B.2 Debt and Interest Table 2019 2020 2021 Outstanding Debt 500,000 500,000 2,500,000 New Net Borrowing 0 2,000,000 0 Interest on Debt 50,000 50,000 210,000 TABLE B.3 Fixed Assets & Capital Investment 2019 2020 2021 Opening Book Value 1,000,000 945,000 2,695,500 Capital Investment 50,000 2,050,000 200,000 Depreciation -105,000 -299,500 -289,550 Closing Book Value 945,000 2,695,500 2,605,950 TABLE 3.4 Income Statement: 2019 2020 Sales 34,200,000 45,229,500 Costs except Depr. -2,736,000 -3,618,360 EBITDA 31,464,000 41,611,140 Depreciation -105,000 -299,500 EBIT 31,359,000 41,311,640 Interest Expense (net) -50,000 -50,000 Pretax Income 31,309,000 41,261,640 Income Tax -9,392,700 -12,378,492 Net Income 21,916,300 28,883,148 ABLE 5 Balance Sheet - Assets: 2019 2020 Assets Cash and Equivalents 11,970,000 15,830,325 Accounts Receivable 10,260,000 13,568,850 Inventories 3,420,000 4,522,950 Total Current Assets 25,650,000 33,922,125 Property, Plant and Equipment 945,000 2,695,500 Total Assets 26,595,000 36,617,625 2019 2020 Balance Sheet - Liabilities and Equity: Liabilities Accounts Payable 10,260,000 13,568,850 Total Current Liabilities 10,260,000 13,568,850 Debt 500,000 2,500,000 Total Liabilities 10,760,000 16,068,850 Stockholders' Equity 1,000,000 15,835,000 Starting Stockholders' Equity Net Income 21,916,300 28,883,148 Dividends -7,081,300 0 15,835,000 44,718,148 Stockholders' Equity Total Liabilities and Equity 26,595,000 60,786,998 TABLE B.6 Working Capital Table 2019 2020 Total Current Assets 25,650,000 33,922,125 Total Current Liabilities 10,260,000 13,568,850 15,390,000 20,353,275 Net Working Capital Increase in Net Working Capital 4,963,275 TABLE B.7 Free Cash Flow of Firms 2019 2020 28,883,148 35,000 Net Income Plus: After-Tax Interest Expense Unlevered Net Income Plus: Depreciation Less: Increases in NWC Less: Capital Expenditures Free Cash Flow of Firm 28,918,148 299,500 -4,963,275 -2,050,000 22,204,373 TABLE B.1 Market Analysis 2019 2020 2021 2022 Market Size 1,000,000 30.000% 1,150,000 34.500% 1,322,500 39.675% 1,520,875 45.626% Market Share Production Volume 300,000 396,750 524,702 693,918 Average Sales Price: 114 114 114 114 Sales 34,200,000 45,229,500 59,816,014 79,106,678 TABLE B.2 Debt and Interest Table 2019 2020 2021 Outstanding Debt 500,000 500,000 2,500,000 New Net Borrowing 0 2,000,000 0 Interest on Debt 50,000 50,000 210,000 TABLE B.3 Fixed Assets & Capital Investment 2019 2020 2021 Opening Book Value 1,000,000 945,000 2,695,500 Capital Investment 50,000 2,050,000 200,000 Depreciation -105,000 -299,500 -289,550 Closing Book Value 945,000 2,695,500 2,605,950 TABLE 3.4 Income Statement: 2019 2020 Sales 34,200,000 45,229,500 Costs except Depr. -2,736,000 -3,618,360 EBITDA 31,464,000 41,611,140 Depreciation -105,000 -299,500 EBIT 31,359,000 41,311,640 Interest Expense (net) -50,000 -50,000 Pretax Income 31,309,000 41,261,640 Income Tax -9,392,700 -12,378,492 Net Income 21,916,300 28,883,148 ABLE 5 Balance Sheet - Assets: 2019 2020 Assets Cash and Equivalents 11,970,000 15,830,325 Accounts Receivable 10,260,000 13,568,850 Inventories 3,420,000 4,522,950 Total Current Assets 25,650,000 33,922,125 Property, Plant and Equipment 945,000 2,695,500 Total Assets 26,595,000 36,617,625 2019 2020 Balance Sheet - Liabilities and Equity: Liabilities Accounts Payable 10,260,000 13,568,850 Total Current Liabilities 10,260,000 13,568,850 Debt 500,000 2,500,000 Total Liabilities 10,760,000 16,068,850 Stockholders' Equity 1,000,000 15,835,000 Starting Stockholders' Equity Net Income 21,916,300 28,883,148 Dividends -7,081,300 0 15,835,000 44,718,148 Stockholders' Equity Total Liabilities and Equity 26,595,000 60,786,998 TABLE B.6 Working Capital Table 2019 2020 Total Current Assets 25,650,000 33,922,125 Total Current Liabilities 10,260,000 13,568,850 15,390,000 20,353,275 Net Working Capital Increase in Net Working Capital 4,963,275 TABLE B.7 Free Cash Flow of Firms 2019 2020 28,883,148 35,000 Net Income Plus: After-Tax Interest Expense Unlevered Net Income Plus: Depreciation Less: Increases in NWC Less: Capital Expenditures Free Cash Flow of Firm 28,918,148 299,500 -4,963,275 -2,050,000 22,204,373Step by Step Solution
There are 3 Steps involved in it
Step: 1

Get Instant Access to Expert-Tailored Solutions
See step-by-step solutions with expert insights and AI powered tools for academic success
Step: 2

Step: 3
Ace Your Homework with AI
Get the answers you need in no time with our AI-driven, step-by-step assistance
Get Started
Short Term Rental Long Term Wealth
Authors: Avery Carl
1st Edition
1947200445, 978-1947200449