Answered step by step
Verified Expert Solution
Link Copied!

Question

1 Approved Answer

Please include a full script and explanation so I may learn for the future! Thank you. Diagram reduction included below vvvvv 9). Nested feedback systems
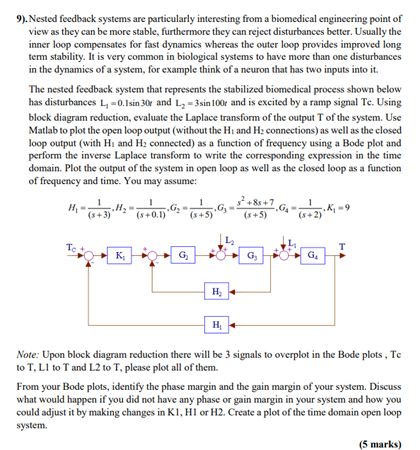
image text in transcribed

Please include a full script and explanation so I may learn for the future! Thank you. Diagram reduction included below vvvvv
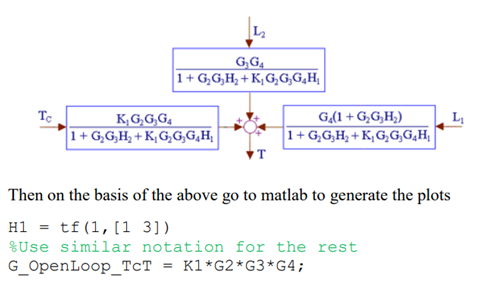
image text in transcribed

9). Nested feedback systems are particularly interesting from a biomedical engineering point of view as they can be more stable, furthermore they can reject disturbances better. Usually the inner loop compensates for fast dynamics whereas the outer loop provides improved long term stability. It is very common in biological systems to have more than one disturbances in the dynamics of a system, for example think of a neuron that has two inputs into it. The nested feedback system that represents the stabilized biomedical process shown below has disturbances L1=0.1sin30r and L2=3sin100r and is excited by a ramp signal Te. Using block diagram reduction, evaluate the Laplace transform of the output T of the system. Use Matlab to plot the open loop output (without the H1 and H2 connections) as well as the closed loop output (with H1 and H2 connected) as a function of frequency using a Bode plot and perform the inverse Laplace transform to write the corresponding expression in the time domain. Plot the output of the system in open loop as well as the closed loop as a function of frequency and time. You may assume: H1=(s+3)1,H2=(s+0.1)1,G2=(s+5)1,G3=(s+5)s2+8s+7,G4=(s+2)1,K1=9 Note: Upon block diagram reduction there will be 3 signals to overplot in the Bode plots, Tc to T, L1 to T and L2 to T, please plot all of them. From your Bode plots, identify the phase margin and the gain margin of your system. Discuss what would happen if you did not have any phase or gain margin in your system and how you could adjust it by making changes in K1,H1 or H2. Create a plot of the time domain open loop system. Then on the basis of the above go to matlab to generate the plots

Step by Step Solution

There are 3 Steps involved in it

Step: 1

blur-text-image

Get Instant Access to Expert-Tailored Solutions

See step-by-step solutions with expert insights and AI powered tools for academic success

Step: 2

blur-text-image

Step: 3

blur-text-image

Ace Your Homework with AI

Get the answers you need in no time with our AI-driven, step-by-step assistance

Get Started

Recommended Textbook for

More Books

Students also viewed these Databases questions