PLEASE INCLUDE ALL EQUATIONS. SORRY FOR ALL THE IMAGES
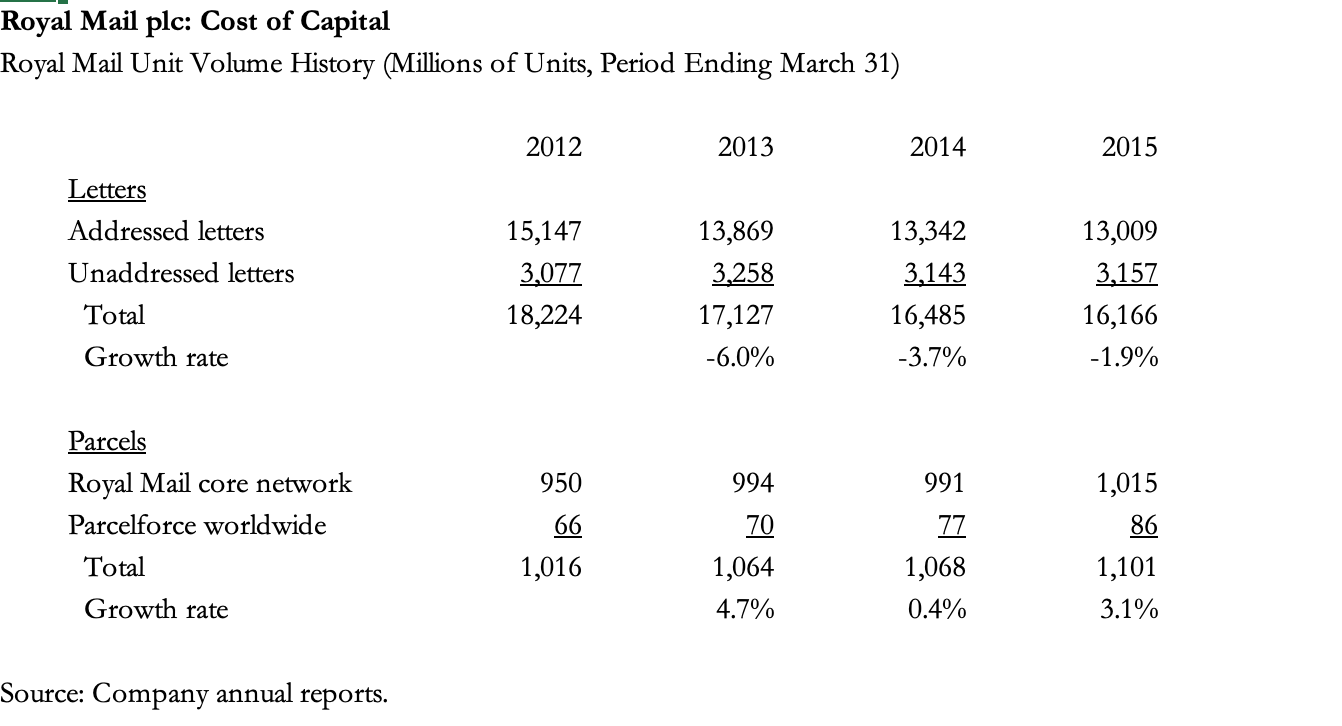
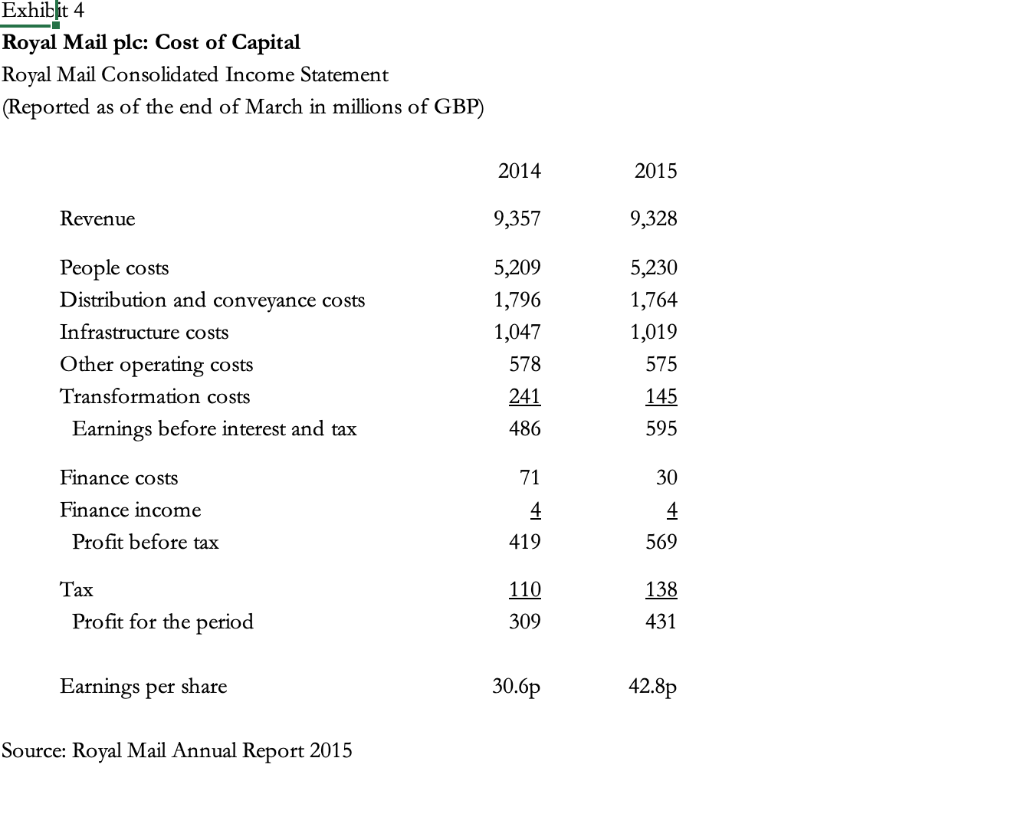
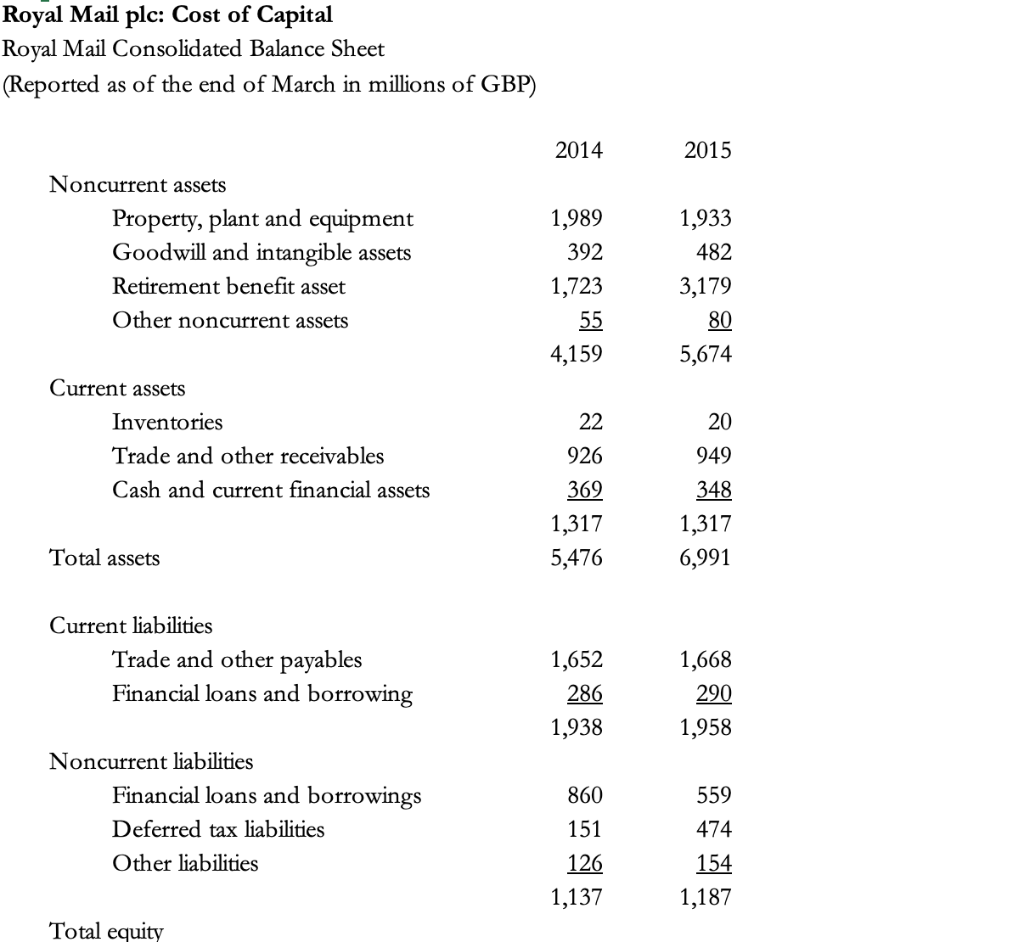

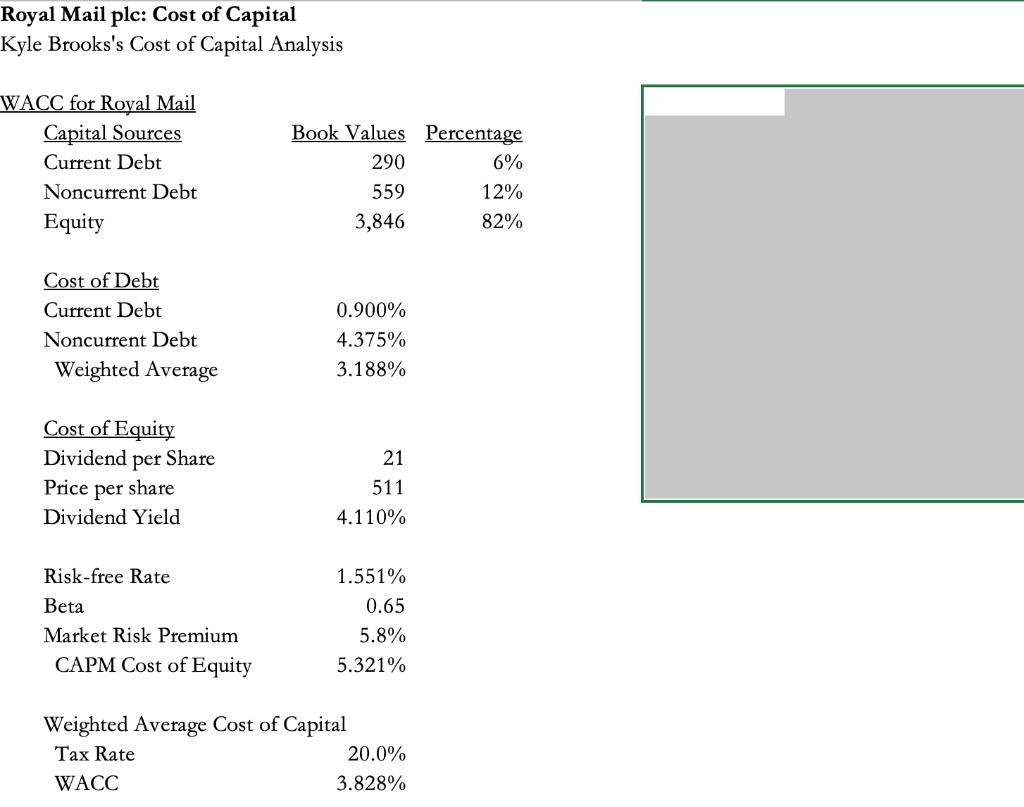
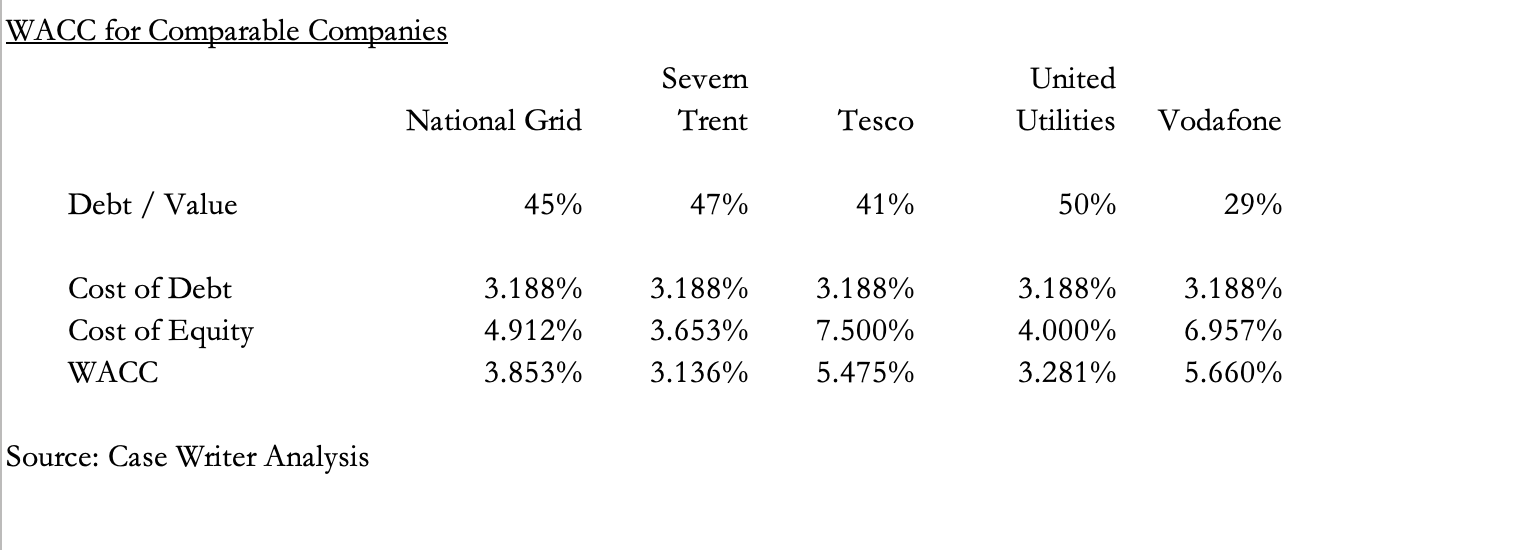
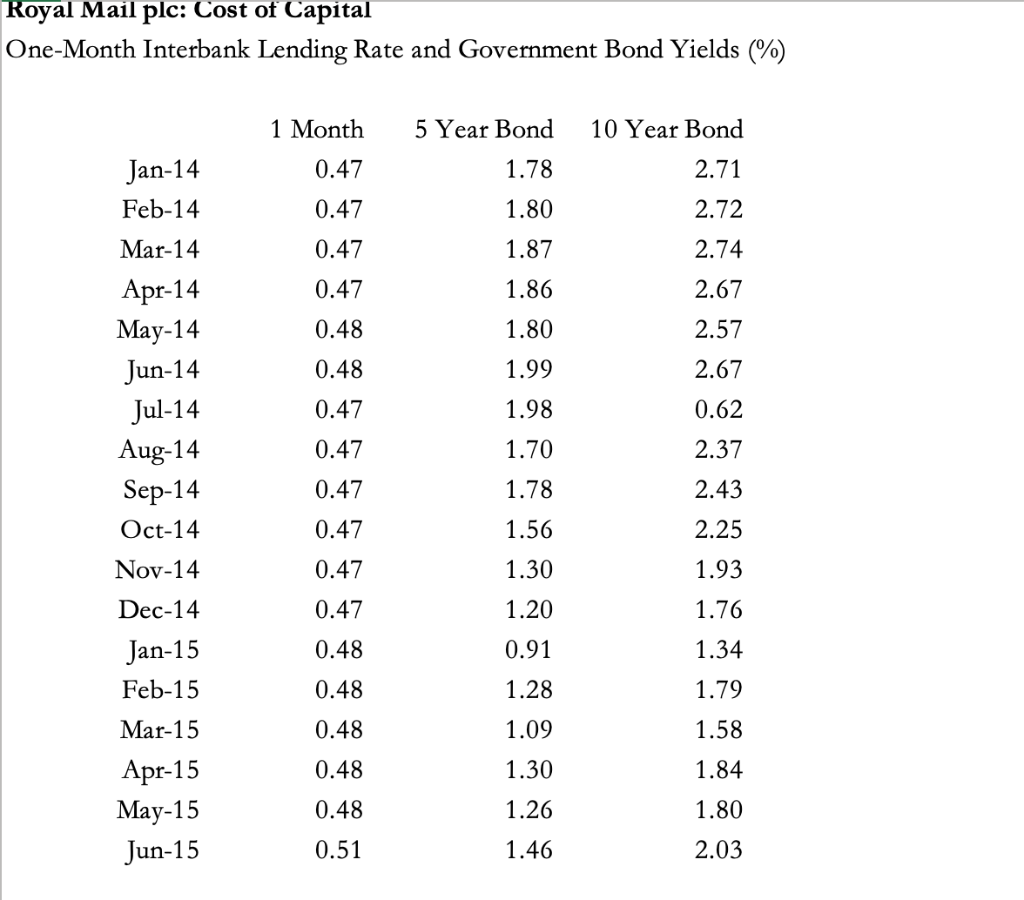
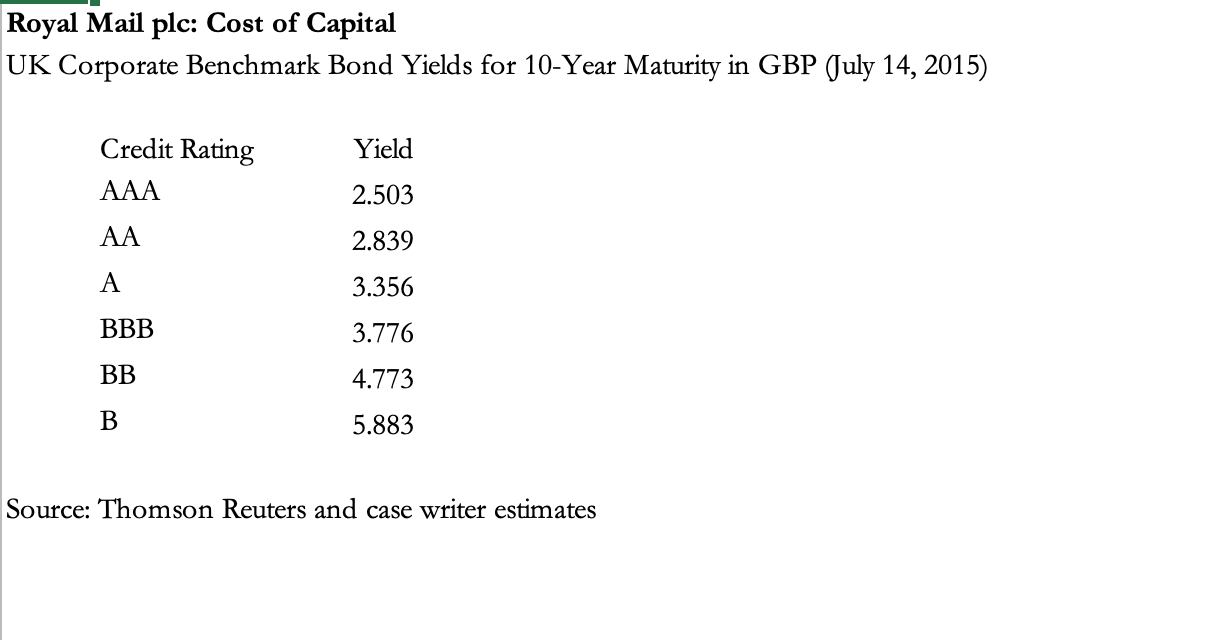
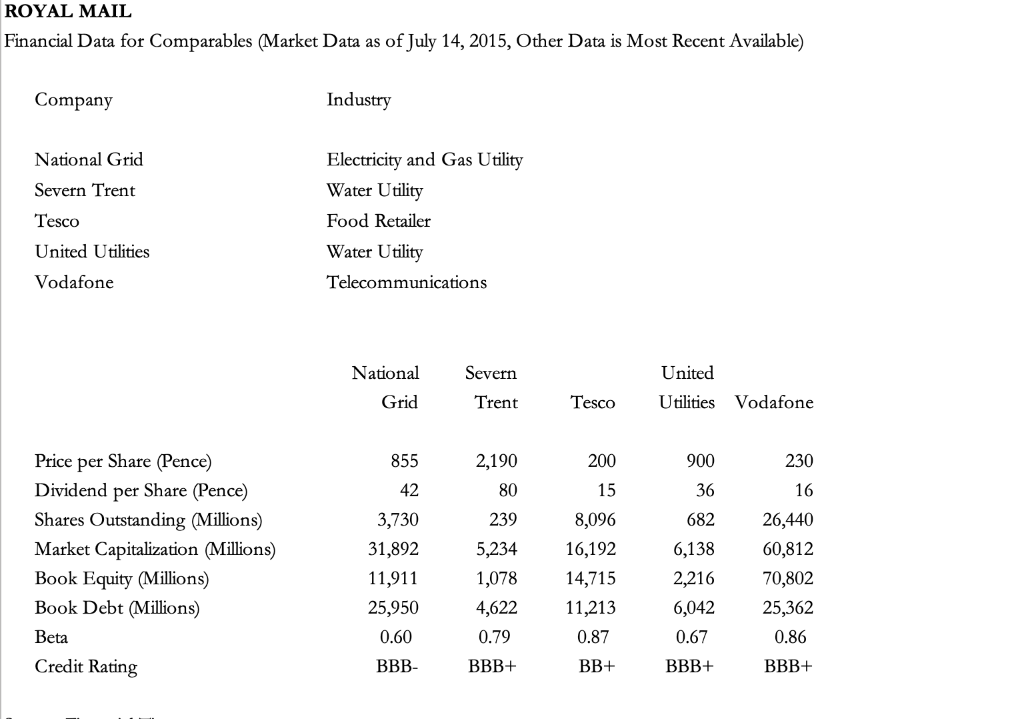
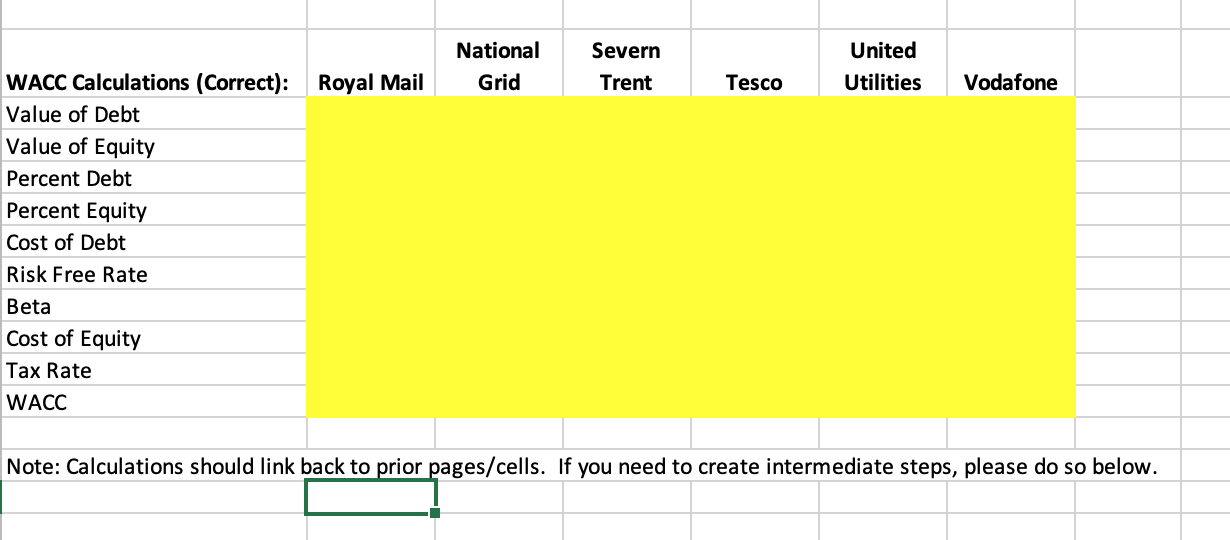
Royal Mail plc: Cost of Capital Royal Mail Unit Volume History (Millions of Units, Period Ending March 31) 2012 2013 2014 2015 Letters Addressed letters Unaddressed letters Total 15,147 3,077 18,224 13,869 3,258 17,127 -6.0% 13,342 3,143 16,485 -3.7% 13,009 3,157 16,166 -1.9% Growth rate 950 994 991 Parcels Royal Mail core network Parcelforce worldwide Total 66 70 1,064 1,015 86 1,101 3.1% 77 1,068 0.4% 1,016 Growth rate 4.7% Source: Company annual reports. Exhibit 4 Royal Mail plc: Cost of Capital Royal Mail Consolidated Income Statement (Reported as of the end of March in millions of GBP) 2014 2015 Revenue 9,357 9,328 People costs Distribution and conveyance costs Infrastructure costs Other operating costs Transformation costs Earnings before interest and tax 5,209 1,796 1,047 578 5,230 1,764 1,019 575 241 145 486 595 71 30 Finance costs Finance income Profit before tax 4 419 4 569 138 Tax Profit for the period 110 309 431 Earnings per share 30.6p 42.8p Source: Royal Mail Annual Report 2015 Royal Mail plc: Cost of Capital Royal Mail Consolidated Balance Sheet (Reported as of the end of March in millions of GBP) 2014 2015 Noncurrent assets Property, plant and equipment Goodwill and intangible assets Retirement benefit asset Other noncurrent assets 1,989 392 1,723 55 4,159 1,933 482 3,179 80 5,674 22 Current assets Inventories Trade and other receivables Cash and current financial assets 20 949 348 926 369 1,317 5,476 1,317 6,991 Total assets Current liabilities Trade and other payables Financial loans and borrowing 1,652 286 1,938 1,668 290 1,958 Noncurrent liabilities Financial loans and borrowings Deferred tax liabilities Other liabilities 559 474 860 151 126 1,137 154 1,187 Total equity Total equity Share capital Retained earnings Other equity 10 2,332 59 2,401 10 3,843 -7 3,846 Royal Mail plc: Cost of Capital Kyle Brooks's Cost of Capital Analysis WACC for Royal Mail Capital Sources Current Debt Noncurrent Debt Equity Book Values Percentage 290 6% 559 12% 82% 3,846 Cost of Debt Current Debt Noncurrent Debt Weighted Average 0.900% 4.375% 3.188% Cost of Equity Dividend per Share Price per share Dividend Yield 21 511 4.110% 1.551% 0.65 Risk-free Rate Beta Market Risk Premium CAPM Cost of Equity 5.8% 5.321% Weighted Average Cost of Capital Tax Rate 20.0% WACC 3.828% WACC for Comparable Companies Severn Trent United Utilities National Grid Tesco Vodafone Debt / Value 45% 47% 41% 50% 29% Cost of Debt Cost of Equity WACC 3.188% 4.912% 3.853% 3.188% 3.653% 3.136% 3.188% 7.500% 5.475% 3.188% 4.000% 3.281% 3.188% 6.957% 5.660% Source: Case Writer Analysis Royal Mail plc: Cost of Capital One-Month Interbank Lending Rate and Government Bond Yields (%) 1 Month 5 Year Bond 10 Year Bond 2.71 1.78 0.47 0.47 0.47 0.47 1.80 1.87 2.72 2.74 2.67 1.86 1.80 2.57 Jan-14 Feb-14 Mar-14 Apr-14 May-14 Jun-14 Jul-14 Aug-14 Sep-14 Oct-14 0.48 0.48 0.47 2.67 1.99 1.98 0.62 0.47 1.70 2.37 0.47 1.78 2.43 0.47 1.56 2.25 Nov-14 0.47 1.30 1.93 Dec-14 0.47 1.20 1.76 0.48 0.91 1.34 Jan-15 Feb-15 0.48 1.28 1.79 Mar-15 0.48 1.09 1.58 0.48 1.30 1.84 Apr-15 May-15 Jun-15 0.48 1.26 1.80 0.51 1.46 2.03 Royal Mail plc: Cost of Capital UK Corporate Benchmark Bond Yields for 10-Year Maturity in GBP (July 14, 2015) Yield Credit Rating AAA 2.503 AA 2.839 A 3.356 BBB 3.776 BB 4.773 B 5.883 Source: Thomson Reuters and case writer estimates ROYAL MAIL Financial Data for Comparables (Market Data as of July 14, 2015, Other Data is Most Recent Available) Company Industry National Grid Severn Trent Tesco Electricity and Gas Utility Water Utility Food Retailer Water Utility Telecommunications United Utilities Vodafone Severn National Grid United Utilities Trent Tesco Vodafone 855 200 900 230 2,190 80 42 15 36 682 Price per Share (Pence) Dividend per Share (Pence) Shares Outstanding (Millions) Market Capitalization (Millions) Book Equity (Millions) Book Debt (Millions) 3,730 31,892 11,911 25,950 0.60 239 5,234 1,078 4,622 0.79 8,096 16,192 14,715 11,213 0.87 6,138 2,216 6,042 16 26,440 60,812 70,802 25,362 0.86 Beta 0.67 Credit Rating BBB- BBB+ BB+ BBB+ BBB+ National Grid Severn Trent United Utilities Tesco Vodafone WACC Calculations (Correct): Royal Mail Value of Debt Value of Equity Percent Debt Percent Equity Cost of Debt Risk Free Rate Beta Cost of Equity Tax Rate WACC Note: Calculations should link back to prior pages/cells. If you need to create intermediate steps, please do so below. Royal Mail plc: Cost of Capital Royal Mail Unit Volume History (Millions of Units, Period Ending March 31) 2012 2013 2014 2015 Letters Addressed letters Unaddressed letters Total 15,147 3,077 18,224 13,869 3,258 17,127 -6.0% 13,342 3,143 16,485 -3.7% 13,009 3,157 16,166 -1.9% Growth rate 950 994 991 Parcels Royal Mail core network Parcelforce worldwide Total 66 70 1,064 1,015 86 1,101 3.1% 77 1,068 0.4% 1,016 Growth rate 4.7% Source: Company annual reports. Exhibit 4 Royal Mail plc: Cost of Capital Royal Mail Consolidated Income Statement (Reported as of the end of March in millions of GBP) 2014 2015 Revenue 9,357 9,328 People costs Distribution and conveyance costs Infrastructure costs Other operating costs Transformation costs Earnings before interest and tax 5,209 1,796 1,047 578 5,230 1,764 1,019 575 241 145 486 595 71 30 Finance costs Finance income Profit before tax 4 419 4 569 138 Tax Profit for the period 110 309 431 Earnings per share 30.6p 42.8p Source: Royal Mail Annual Report 2015 Royal Mail plc: Cost of Capital Royal Mail Consolidated Balance Sheet (Reported as of the end of March in millions of GBP) 2014 2015 Noncurrent assets Property, plant and equipment Goodwill and intangible assets Retirement benefit asset Other noncurrent assets 1,989 392 1,723 55 4,159 1,933 482 3,179 80 5,674 22 Current assets Inventories Trade and other receivables Cash and current financial assets 20 949 348 926 369 1,317 5,476 1,317 6,991 Total assets Current liabilities Trade and other payables Financial loans and borrowing 1,652 286 1,938 1,668 290 1,958 Noncurrent liabilities Financial loans and borrowings Deferred tax liabilities Other liabilities 559 474 860 151 126 1,137 154 1,187 Total equity Total equity Share capital Retained earnings Other equity 10 2,332 59 2,401 10 3,843 -7 3,846 Royal Mail plc: Cost of Capital Kyle Brooks's Cost of Capital Analysis WACC for Royal Mail Capital Sources Current Debt Noncurrent Debt Equity Book Values Percentage 290 6% 559 12% 82% 3,846 Cost of Debt Current Debt Noncurrent Debt Weighted Average 0.900% 4.375% 3.188% Cost of Equity Dividend per Share Price per share Dividend Yield 21 511 4.110% 1.551% 0.65 Risk-free Rate Beta Market Risk Premium CAPM Cost of Equity 5.8% 5.321% Weighted Average Cost of Capital Tax Rate 20.0% WACC 3.828% WACC for Comparable Companies Severn Trent United Utilities National Grid Tesco Vodafone Debt / Value 45% 47% 41% 50% 29% Cost of Debt Cost of Equity WACC 3.188% 4.912% 3.853% 3.188% 3.653% 3.136% 3.188% 7.500% 5.475% 3.188% 4.000% 3.281% 3.188% 6.957% 5.660% Source: Case Writer Analysis Royal Mail plc: Cost of Capital One-Month Interbank Lending Rate and Government Bond Yields (%) 1 Month 5 Year Bond 10 Year Bond 2.71 1.78 0.47 0.47 0.47 0.47 1.80 1.87 2.72 2.74 2.67 1.86 1.80 2.57 Jan-14 Feb-14 Mar-14 Apr-14 May-14 Jun-14 Jul-14 Aug-14 Sep-14 Oct-14 0.48 0.48 0.47 2.67 1.99 1.98 0.62 0.47 1.70 2.37 0.47 1.78 2.43 0.47 1.56 2.25 Nov-14 0.47 1.30 1.93 Dec-14 0.47 1.20 1.76 0.48 0.91 1.34 Jan-15 Feb-15 0.48 1.28 1.79 Mar-15 0.48 1.09 1.58 0.48 1.30 1.84 Apr-15 May-15 Jun-15 0.48 1.26 1.80 0.51 1.46 2.03 Royal Mail plc: Cost of Capital UK Corporate Benchmark Bond Yields for 10-Year Maturity in GBP (July 14, 2015) Yield Credit Rating AAA 2.503 AA 2.839 A 3.356 BBB 3.776 BB 4.773 B 5.883 Source: Thomson Reuters and case writer estimates ROYAL MAIL Financial Data for Comparables (Market Data as of July 14, 2015, Other Data is Most Recent Available) Company Industry National Grid Severn Trent Tesco Electricity and Gas Utility Water Utility Food Retailer Water Utility Telecommunications United Utilities Vodafone Severn National Grid United Utilities Trent Tesco Vodafone 855 200 900 230 2,190 80 42 15 36 682 Price per Share (Pence) Dividend per Share (Pence) Shares Outstanding (Millions) Market Capitalization (Millions) Book Equity (Millions) Book Debt (Millions) 3,730 31,892 11,911 25,950 0.60 239 5,234 1,078 4,622 0.79 8,096 16,192 14,715 11,213 0.87 6,138 2,216 6,042 16 26,440 60,812 70,802 25,362 0.86 Beta 0.67 Credit Rating BBB- BBB+ BB+ BBB+ BBB+ National Grid Severn Trent United Utilities Tesco Vodafone WACC Calculations (Correct): Royal Mail Value of Debt Value of Equity Percent Debt Percent Equity Cost of Debt Risk Free Rate Beta Cost of Equity Tax Rate WACC Note: Calculations should link back to prior pages/cells. If you need to create intermediate steps, please do so below


