PLEASE INCLUDE ALL FORMULAS FOR EXCEL
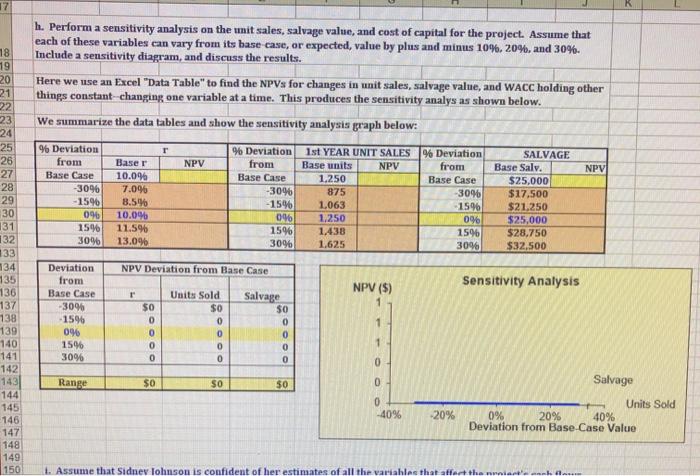
18 19 20 21 22 23 24 25 h. Perform a sensitivity analysis on the unit sales, salvage value, and cost of capital for the project. Assume that each of these variables can vary from its base case, or expected, value by plus and minus 10%, 20%, and 30%. Include a sensitivity diagram, and discuss the results. Here we use an Excel "Data Table" to find the NPVs for changes in unit sales, salvage value, and WACC holding other things constant-changing one variable at a time. This produces the sensitivity analys as shown below. We summarize the data tables and show the sensitivity analysis graph below: 96 Deviation 96 Deviation 1st YEAR UNIT SALES % Deviation SALVAGE from Baser NPV from Base units from Base Salv. NPV Base Case 10.096 Base Case 1.250 Base Case $25,000 -3096 7.096 -3096 875 $17.500 -15% 8.5% -15% 1,063 15% $21,250 096 10.0% 09 1,250 0% $25,000 159 11.596 15% 1.438 1596 $28,750 30% 13.0% 3096 1.625 30% $32,500 26 NPV 27 28 3096 29 30 131 132 133 134 135 136 137 138 NPV Deviation from Base Case NPV ($) Sensitivity Analysis Deviation from Base Case -30% 1596 096 1596 30% $0 0 0 0 0 139 Units Sold $0 0 0 0 0 Salvage $0 0 0 0 1 0 0 Range $0 $0 $0 0 Salvage 140 141 142 143 144 145 -146 147 148 149 150 0 -40% -20% Units Sold 0% 20% 40% Deviation from Base Case Value 1. Assume that Sidney Johnson is confident of her estimates of all the variables that affect the man 18 19 20 21 22 23 24 25 h. Perform a sensitivity analysis on the unit sales, salvage value, and cost of capital for the project. Assume that each of these variables can vary from its base case, or expected, value by plus and minus 10%, 20%, and 30%. Include a sensitivity diagram, and discuss the results. Here we use an Excel "Data Table" to find the NPVs for changes in unit sales, salvage value, and WACC holding other things constant-changing one variable at a time. This produces the sensitivity analys as shown below. We summarize the data tables and show the sensitivity analysis graph below: 96 Deviation 96 Deviation 1st YEAR UNIT SALES % Deviation SALVAGE from Baser NPV from Base units from Base Salv. NPV Base Case 10.096 Base Case 1.250 Base Case $25,000 -3096 7.096 -3096 875 $17.500 -15% 8.5% -15% 1,063 15% $21,250 096 10.0% 09 1,250 0% $25,000 159 11.596 15% 1.438 1596 $28,750 30% 13.0% 3096 1.625 30% $32,500 26 NPV 27 28 3096 29 30 131 132 133 134 135 136 137 138 NPV Deviation from Base Case NPV ($) Sensitivity Analysis Deviation from Base Case -30% 1596 096 1596 30% $0 0 0 0 0 139 Units Sold $0 0 0 0 0 Salvage $0 0 0 0 1 0 0 Range $0 $0 $0 0 Salvage 140 141 142 143 144 145 -146 147 148 149 150 0 -40% -20% Units Sold 0% 20% 40% Deviation from Base Case Value 1. Assume that Sidney Johnson is confident of her estimates of all the variables that affect the man