Answered step by step
Verified Expert Solution
Question
1 Approved Answer
Aragon Equipment, Inc. is a tractor manufacturer that is beginning to realize the importance of sales data in marketing its products. Its two main


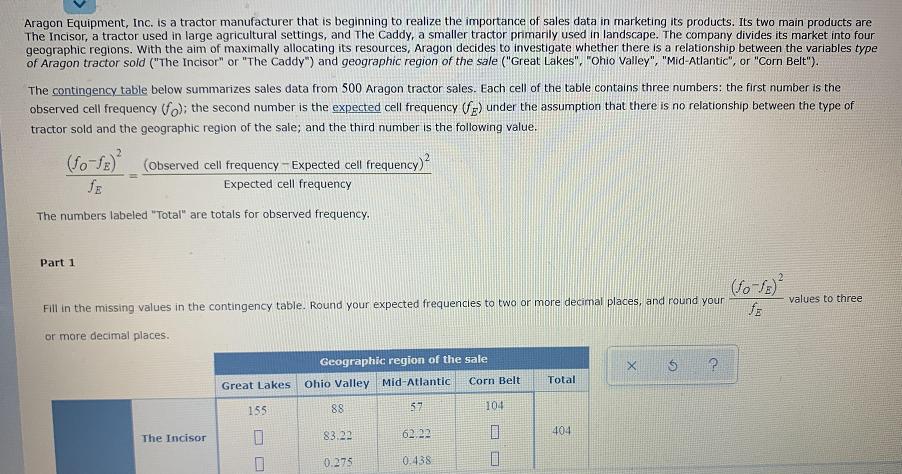
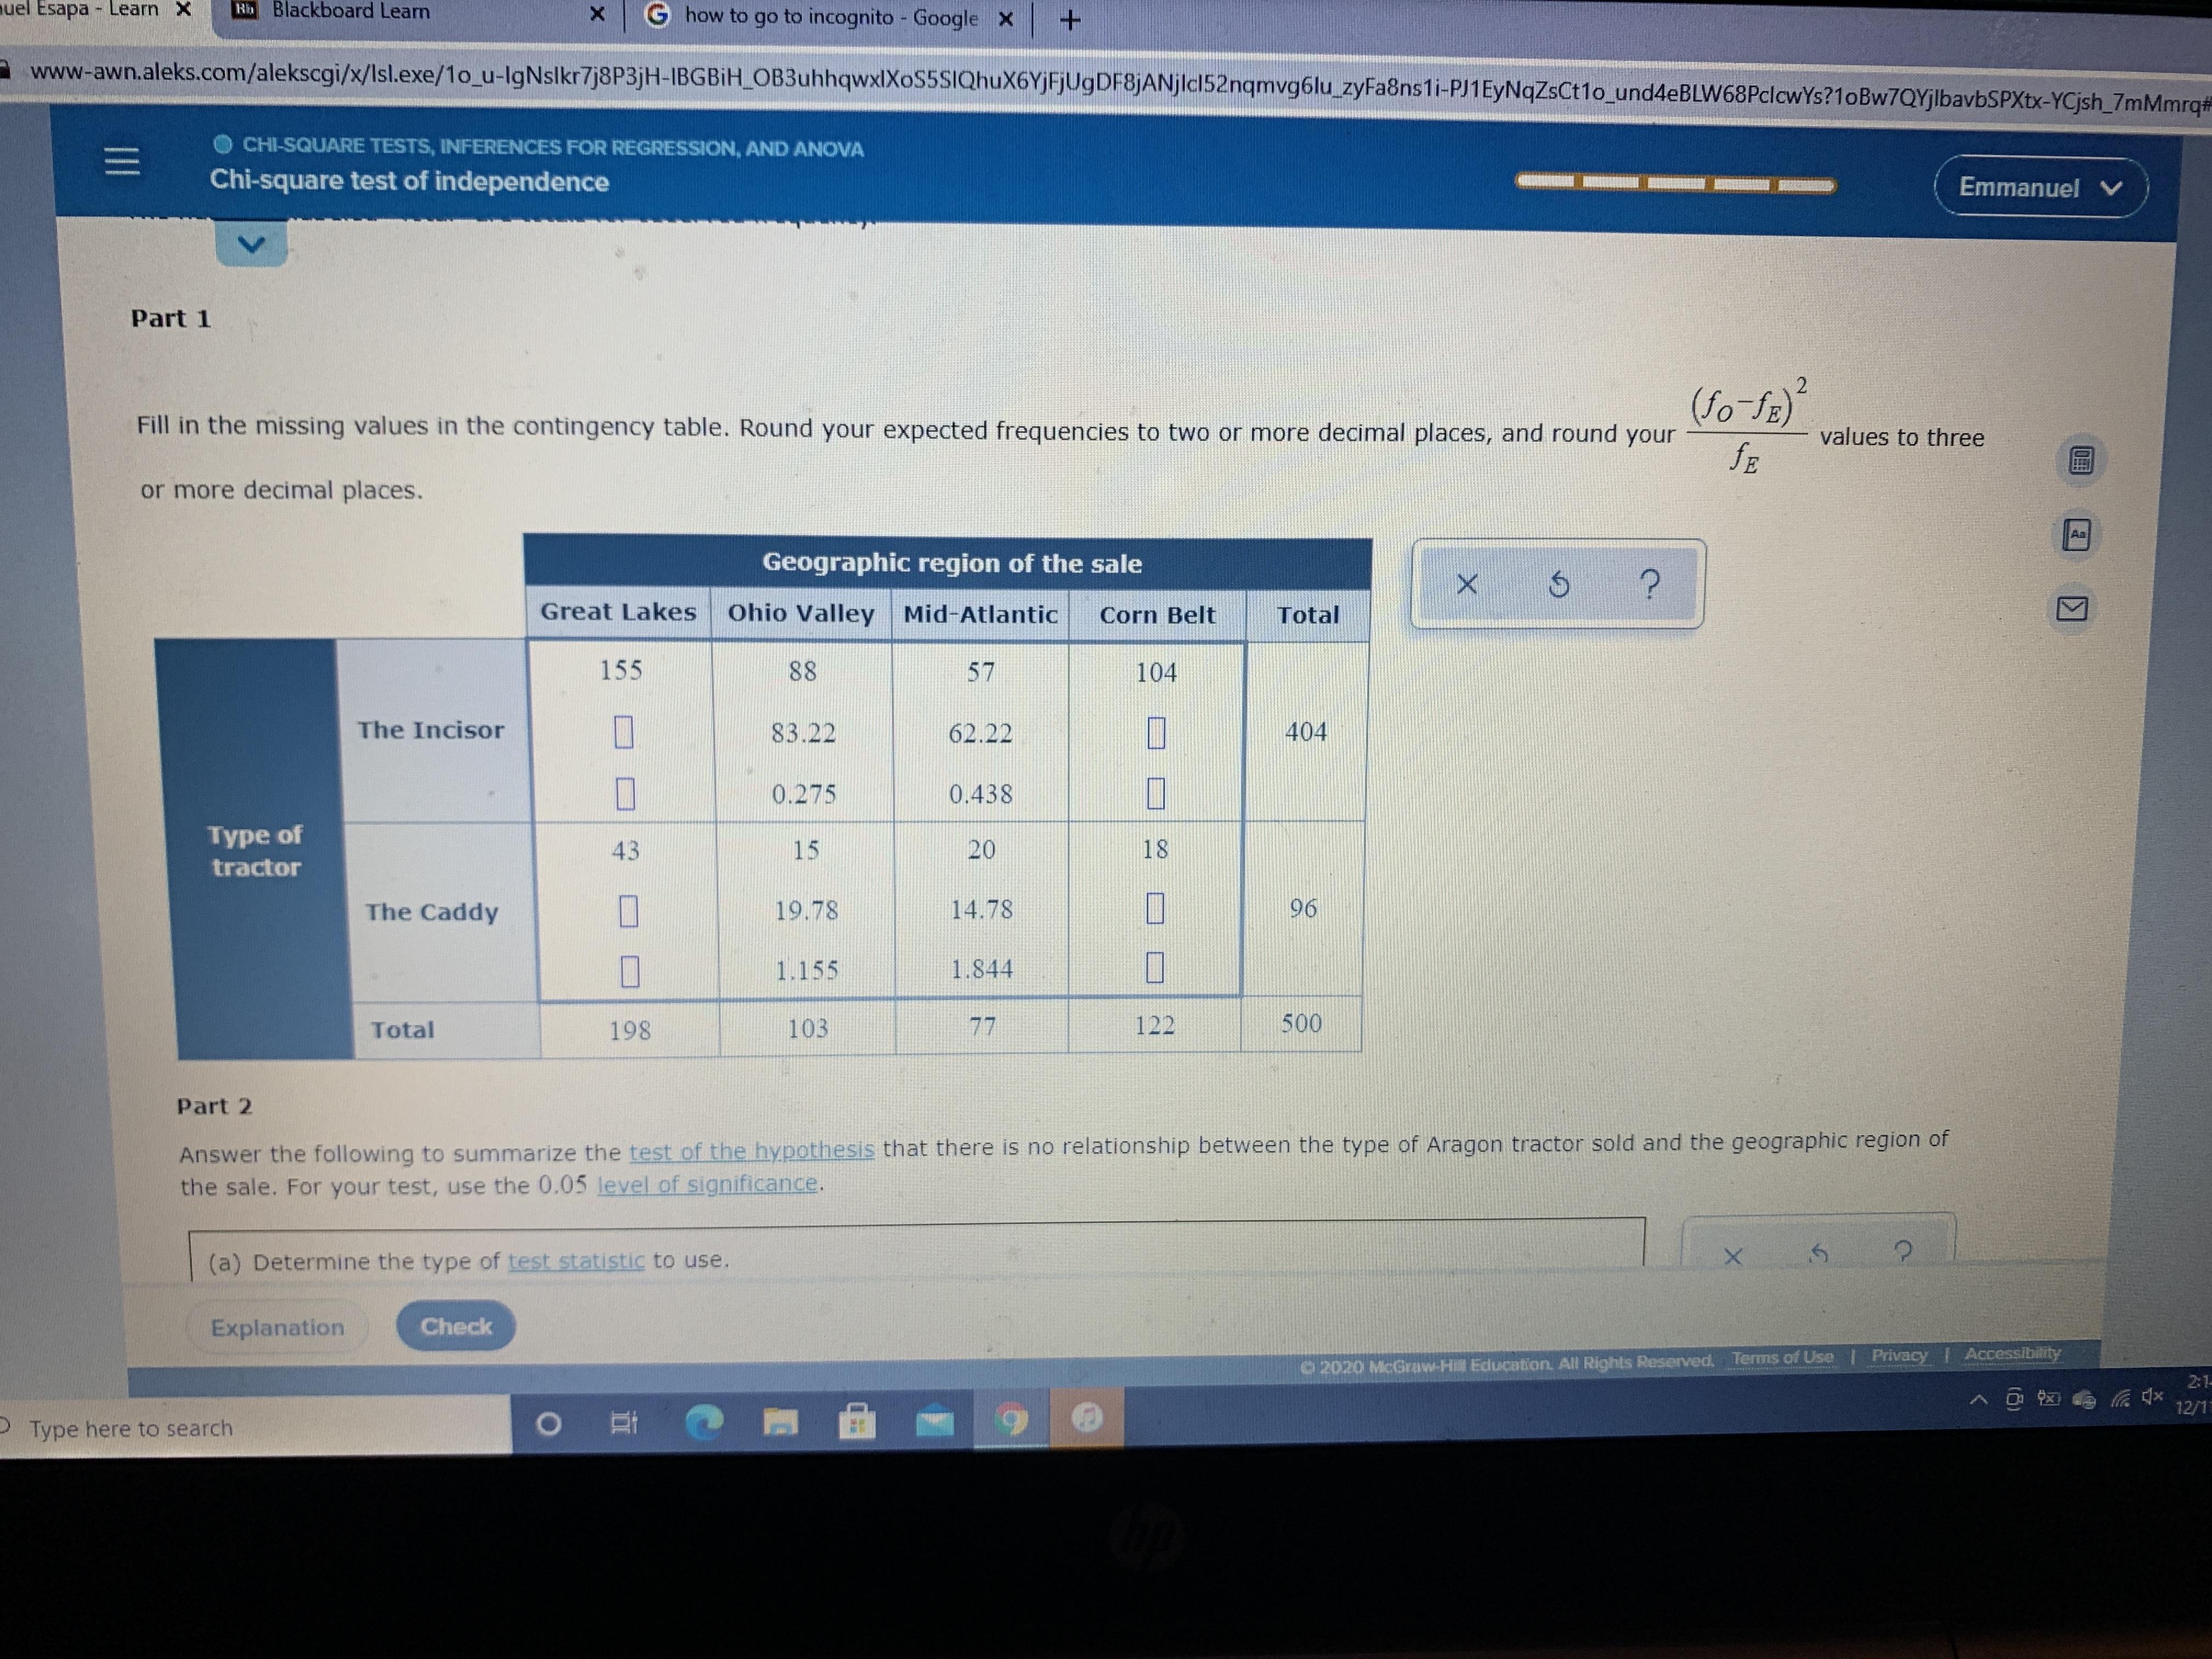
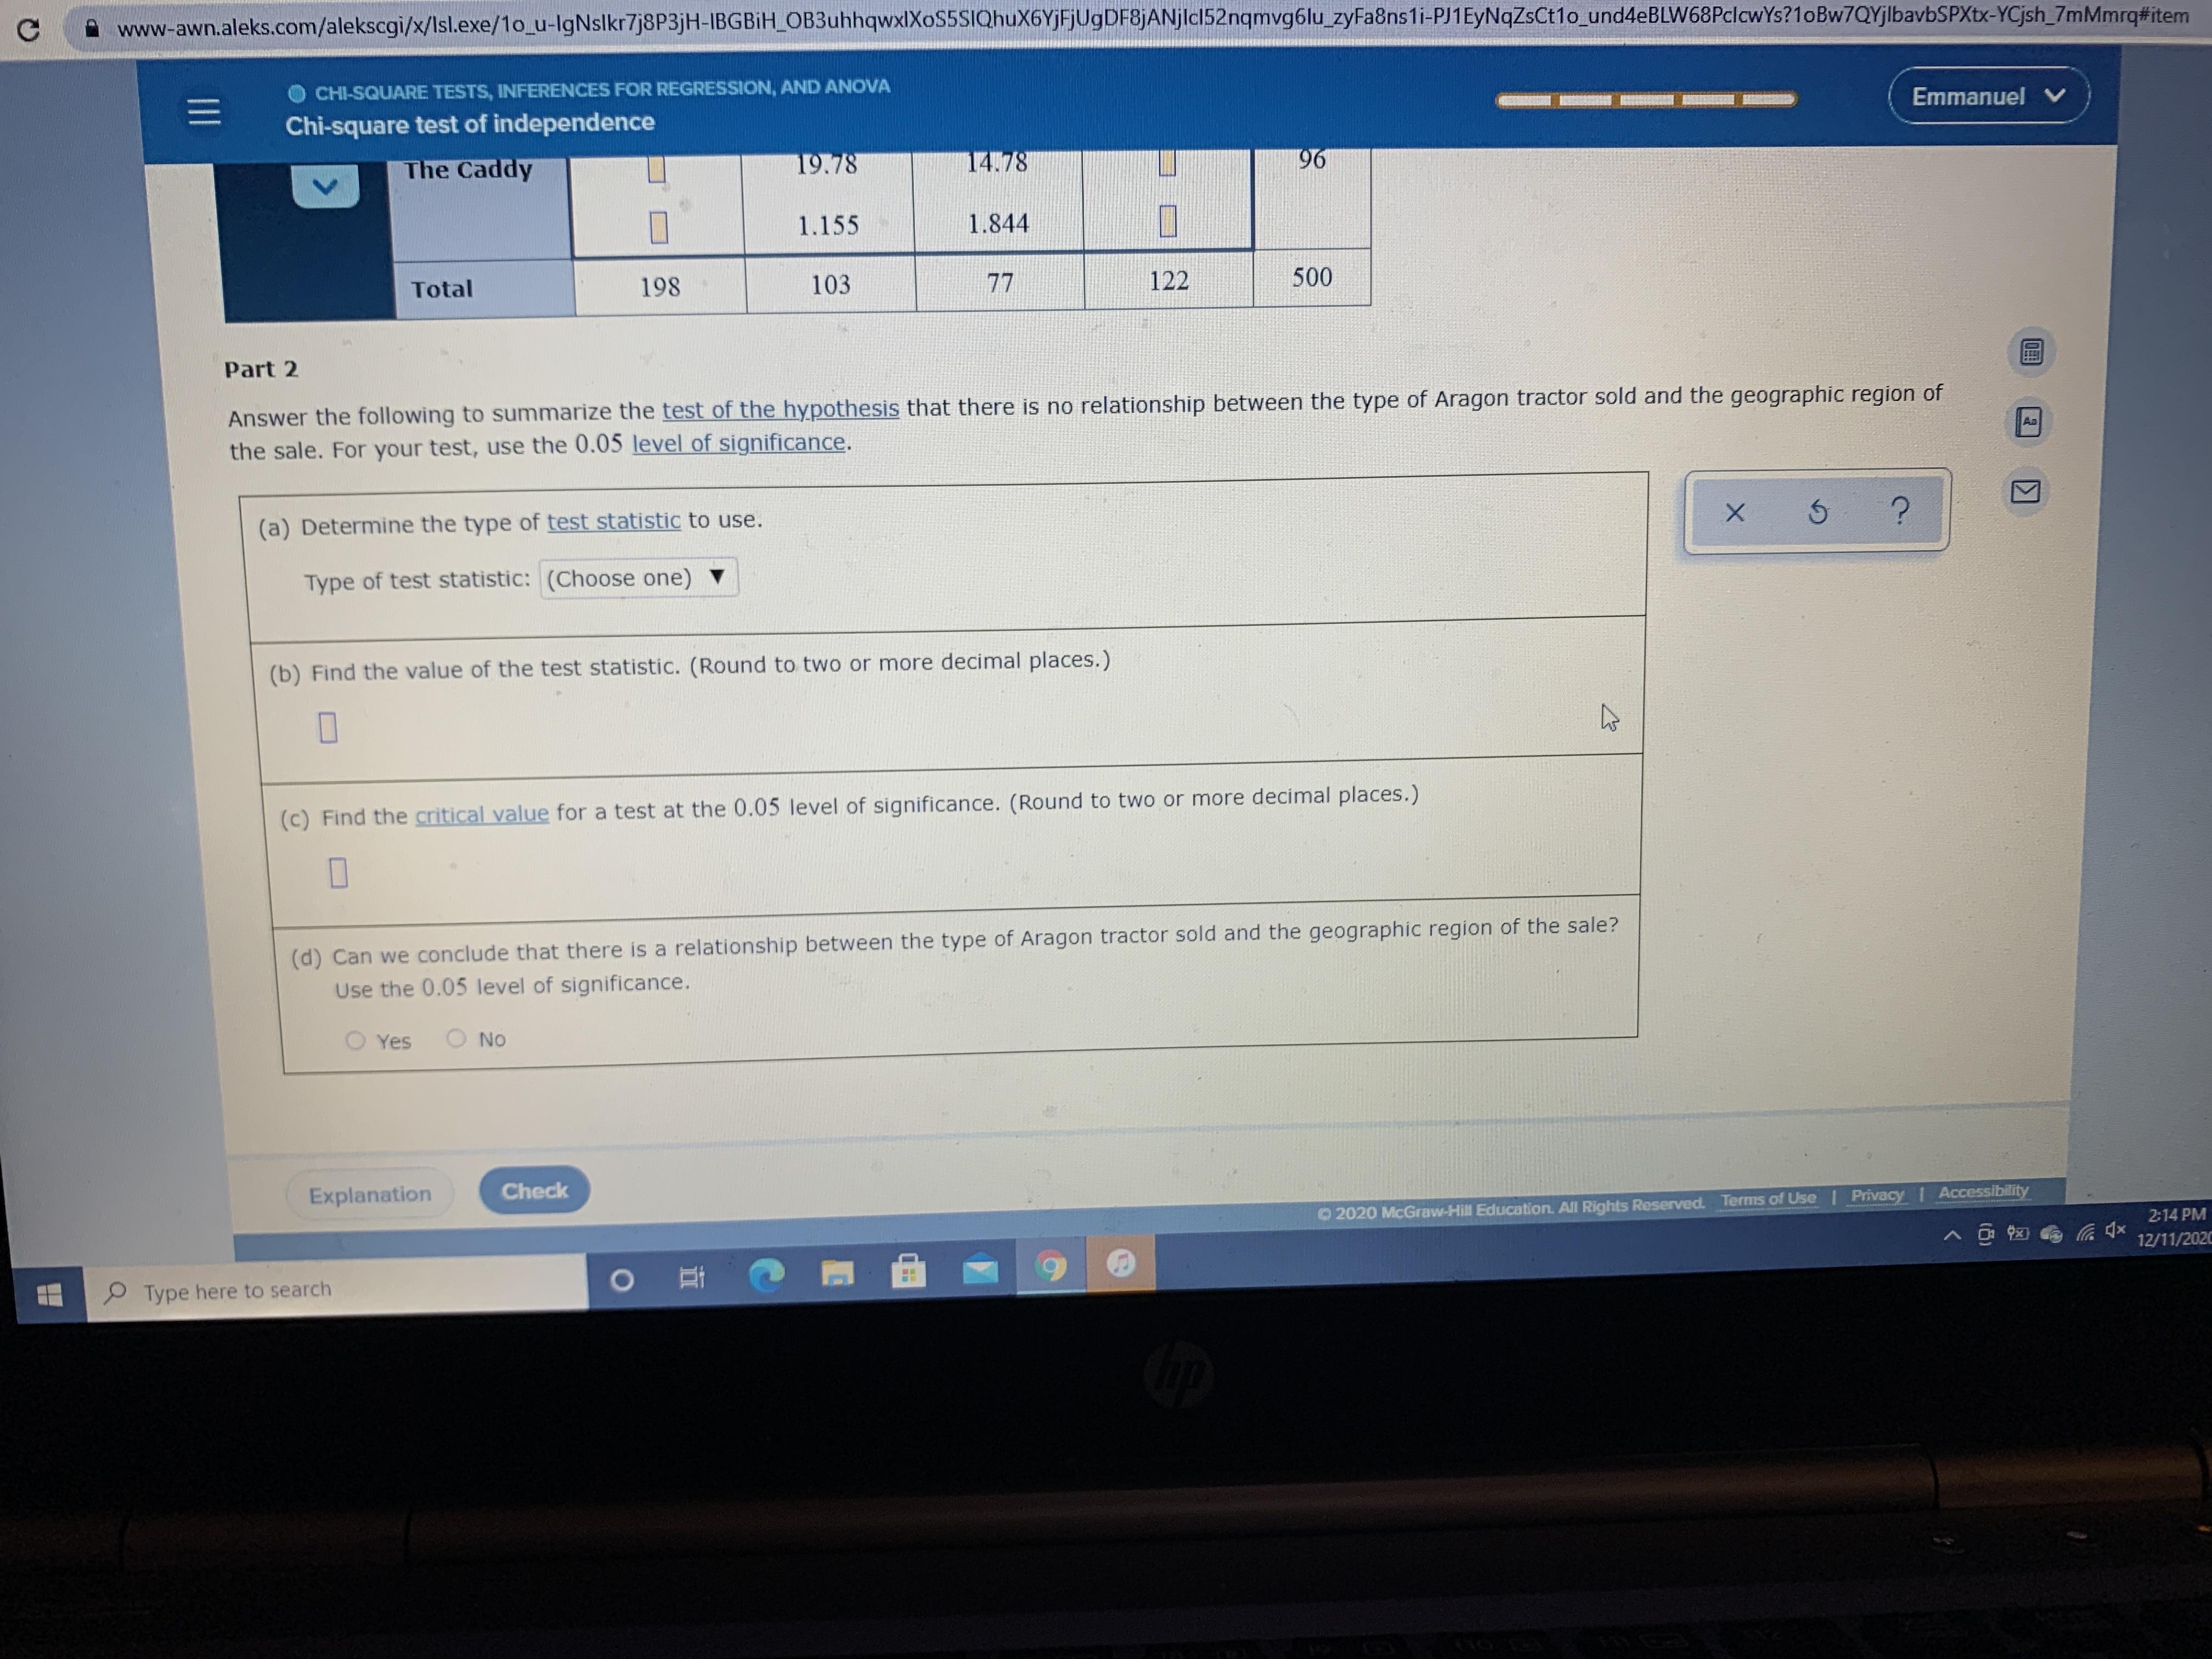
Aragon Equipment, Inc. is a tractor manufacturer that is beginning to realize the importance of sales data in marketing its products. Its two main products are The Incisor, a tractor used in large agricultural settings, and The Caddy, a smaller tractor primarily used in landscape. The company divides its market into four geographic regions. With the aim of maximally allocating its resources, Aragon decides to investigate whether there is a relationship between the variables type of Aragon tractor sold ("The Incisor" or "The Caddy") and geographic region of the sale ("Great Lakes", "Ohio Valley", "Mid-Atlantic", or "Corn Belt"). The contingency table below summarizes sales data from 500 Aragon tractor sales. Each cell of the table contains three numbers: the first number is the observed cell frequency (fo); the second number is the expected cell frequency (fr) under the assumption that there is no relationship between the type of tractor sold and the geographic region of the sale; and the third number is the following value. (Observed cell frequency- Expected cell frequency) fE Expected cell frequency The numbers labeled "Total" are totals for observed frequency, Part 1 values to three Fill in the missing values in the contingency table. Round your expected frequencies to two or more decimal places, and round your or more decimal places. Geographic region of the sale Corn Belt Total Great Lakes Ohio Valley Mid-Atlantic 155 88 57 104 83.22 62 22 404 The Incisor 0.275 0.438 D O uel Esapa Learn X Rb Blackboard Learn G how to go to incognito - Google X www-awn.aleks.com/alekscgi/x/lIsl.exe/1o_u-lgNslkr7j8P3jH-IBGBIH_OB3uhhqwxlXoS5SIQhuX6YjFjUgDF8jANjlcl52nqmvg6lu_zyFa8ns1i-PJ1EyNqZsCt1o_und4eBLW68PclcwYs?1oBw7QYjlbavbSPXtx-YCjsh_7mMmrq# O CHI-SQUARE TESTS, INFERENCES FOR REGRESSION, AND ANOVA Chi-square test of independence Emmanuel V Part 1 2 Fill in the missing values in the contingency table. Round your expected frequencies to two or more decimal places, and round your values to three fE or more decimal places. Aa Geographic region of the sale Great Lakes Ohio Valley Mid-Atlantic Corn Belt Total 155 88 57 104 The Incisor 83.22 62.22 404 0.275 0.438 e of 43 20 18 15 tractor The Caddy 19.78 14.78 96 1.155 1.844 Total 198 103 77 122 500 Part 2 Answer the following to summarize the test of the hypothesis that there is no relationship between the type of Aragon tractor sold and the geographic region of the sale. For your test, use the 0.05 level of significance. (a) Determine the type of test statistic to use. Explanation Check 2020 McGraw-Hill Education. All Rights Reserved, Terms of Use Privacy Accessibility 2-1 12/1 P Type here to search www-awn.aleks.com/alekscgi/x/lsl.exe/1o_u-lgNslkr7j8P3jH-IBGBIH_OB3uhhqwxlXoS5SIQhuX6YjFjUgDF8jANjlcl52nqmvg6lu_zyFa8ns1i-PJ1EyNqZsCt1o_und4eBLW68PclcwYs?1oBw7QYjlbavbSPXtx-YCjsh_7mMmrq#item O CHI-SQUARE TESTS, INFERENCES FOR REGRESSION, AND ANOVA Emmanuel V Chi-square test of independence The Caddy 19.78 14.78 96 1.155 1.844 Total 198 103 77 122 500 Part 2 Answer the following to summarize the test of the hypothesis that there is no relationship between the type of Aragon tractor sold and the geographic region of the sale. For your test, use the 0.05 level of significance. Aa (a) Determine the type of test statistic to use. Type of test statistic: (Choose one) (b) Find the value of the test statistic. (Round to two or more decimal places.) (c) Find the critical value for a test at the 0.05 level of significance. (Round to two or more decimal places.) (d) Can we conclude that there is a relationship between the type of Aragon tractor sold and the geographic region of the sale? Use the 0.05 level of significance. Yes O No O 2020 McGraw-Hill Education. All Rights Reserved. Terms of Use | Privacy Accessibility g Explanation Check 2:14 PM 12/11/202C P Type here to search II
Step by Step Solution
★★★★★
3.35 Rating (167 Votes )
There are 3 Steps involved in it
Step: 1

Get Instant Access to Expert-Tailored Solutions
See step-by-step solutions with expert insights and AI powered tools for academic success
Step: 2

Step: 3

Ace Your Homework with AI
Get the answers you need in no time with our AI-driven, step-by-step assistance
Get Started


