Answered step by step
Verified Expert Solution
Link Copied!

Question

1 Approved Answer

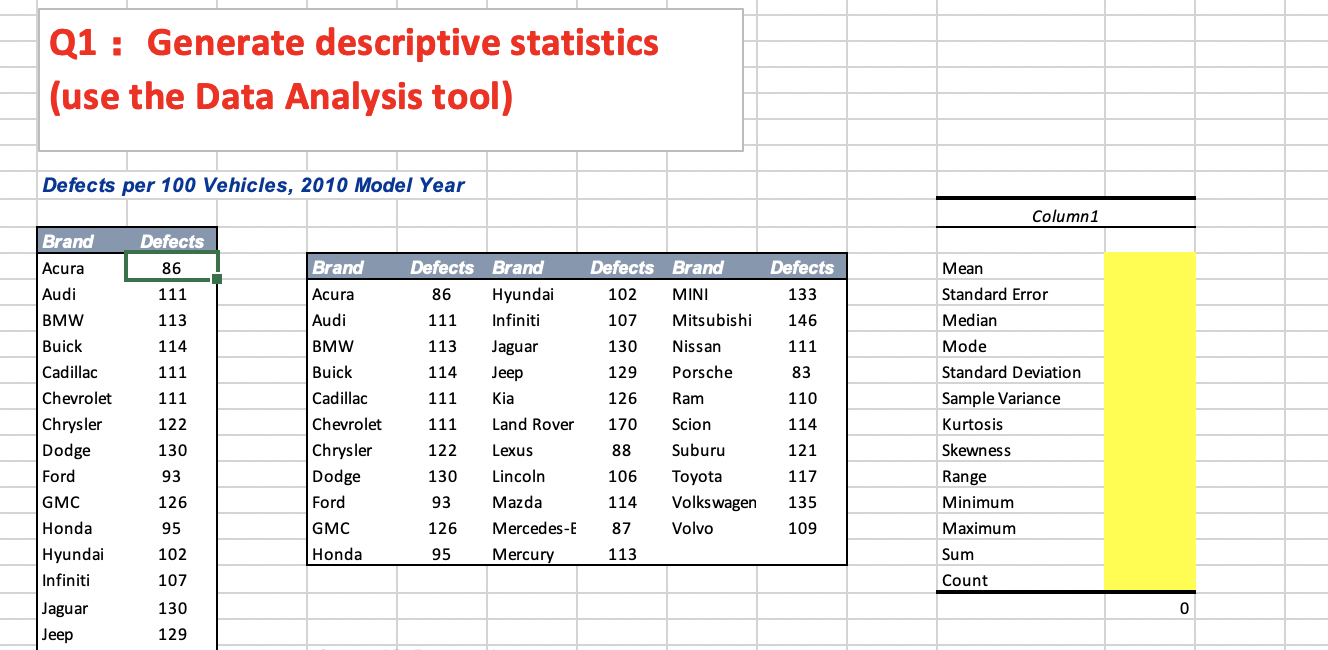
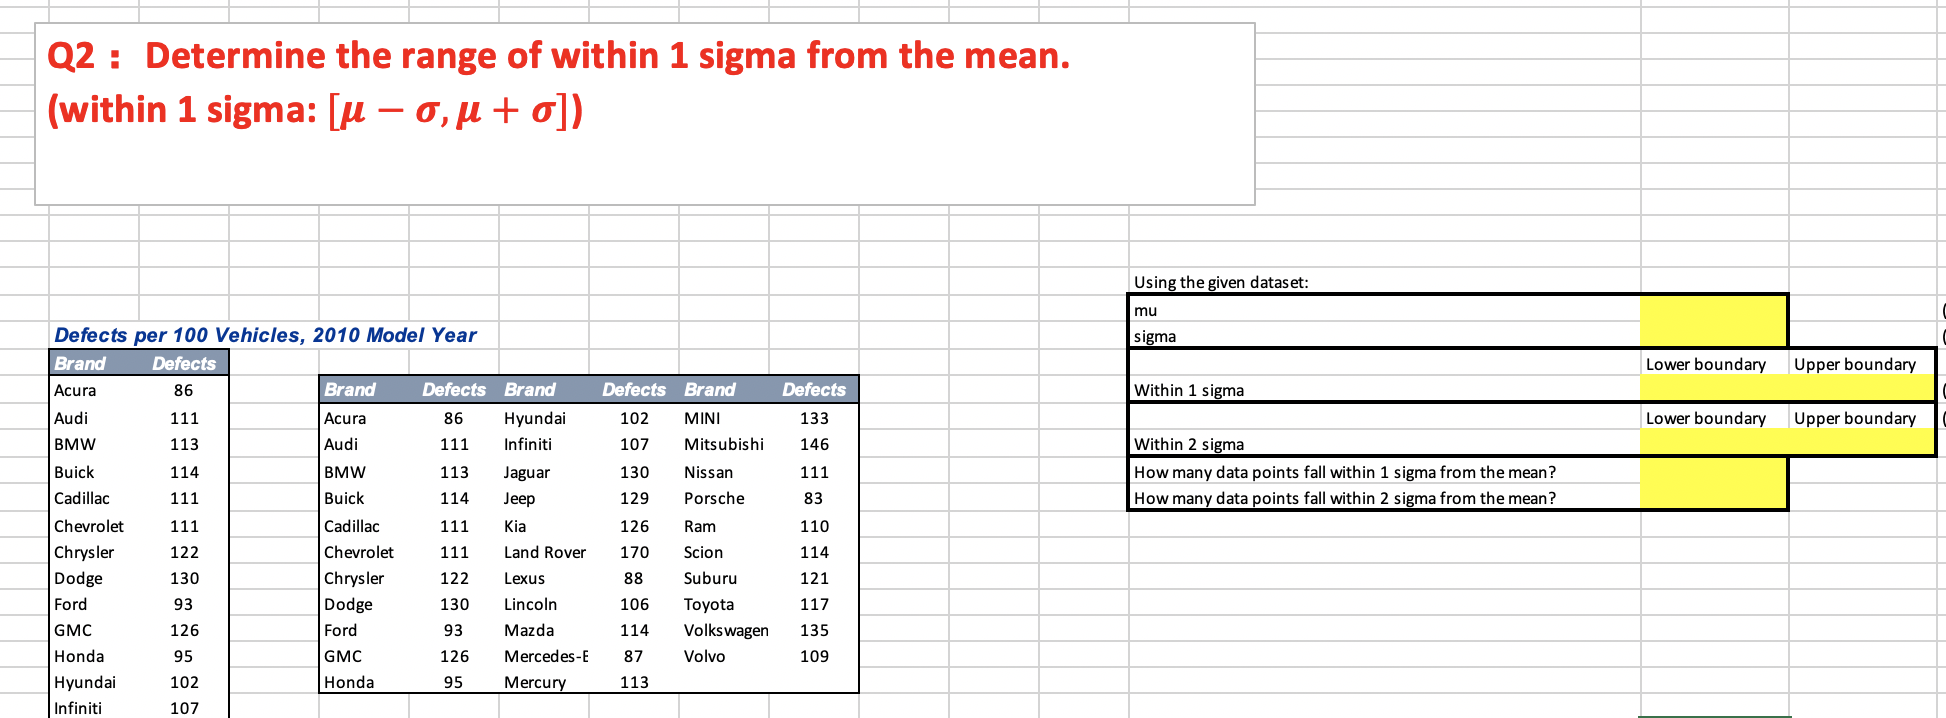
Please include detailed excel formula Q1 : Generate descriptive statistics (use the Data Analysis tool) Defects per 100 Vehicles, 2010 Model Year Column1 Brand Defects

Please include detailed excel formula

image text in transcribedimage text in transcribed
Q1 : Generate descriptive statistics (use the Data Analysis tool) Defects per 100 Vehicles, 2010 Model Year Column1 Brand Defects Acura 86 Brand Defects Brand Defects Brand Defects Mean Audi 111 Acura 86 Hyundai 102 MINI 133 Standard Error BMW 113 Audi 111 Infiniti 107 Mitsubishi 146 Median Buick 114 BMW 113 Jaguar 130 Nissan 111 Mode Cadillac 111 Buick 114 Jeep 129 Porsche 83 Standard Deviation Chevrolet 111 Cadillac 111 Kia 126 Ram 110 Sample Variance Chrysler 122 Chevrolet 111 Land Rover 170 Scion 114 Kurtosis Dodge 130 Chrysler 122 Lexus 88 Suburu 121 Skewness Ford 93 Dodge 130 Lincoln 106 Toyota 117 Range GMC 126 Ford 93 Mazda 114 Volkswagen 135 Minimum Honda 95 GMC 126 Mercedes-E 87 Volvo 109 Maximum Hyundai 102 Honda 95 Mercury 113 Sum Infiniti 107 Count Jaguar 130 0 Jeep 129Q2 : Determine the range of within 1 sigma from the mean. (within 1 sigma: [u - o, u + o]) Using the given dataset: mu sigma Defects per 100 Vehicles, 2010 Model Year Lower boundary Upper boundary Brand Defects Defects Within 1 sigma Acura 86 Brand Defects Brand Defects Brand Lower boundary Upper boundary Audi 111 Acura 86 Hyundai 102 MINI 133 Within 2 sigma BMW 113 Audi 111 Infiniti 107 Mitsubishi 146 How many data points fall within 1 sigma from the mean? 114 BMW 113 Jaguar 130 Nissan 111 Buick How many data points fall within 2 sigma from the mean? Cadillac 111 Buick 114 Jeep 129 Porsche 83 Chevrolet 111 Cadillac 111 Kia 126 Ram 110 Chrysler 122 Chevrolet 111 Land Rover 170 Scion 114 121 Dodge 130 Chrysler 122 Lexus 88 Suburu Ford 93 Dodge 130 Lincoln 106 Toyota 117 GMC 126 Ford 93 Mazda 114 Volkswagen 135 Honda 95 GMC 126 Mercedes-E 87 Volvo 109 Hyundai 102 Honda 95 Mercury 113 Infiniti 107

Step by Step Solution

There are 3 Steps involved in it

Step: 1

blur-text-image

Get Instant Access to Expert-Tailored Solutions

See step-by-step solutions with expert insights and AI powered tools for academic success

Step: 2

blur-text-image

Step: 3

blur-text-image

Ace Your Homework with AI

Get the answers you need in no time with our AI-driven, step-by-step assistance

Get Started

Recommended Textbook for

Applied Calculus

Authors: Stefan Waner, Steven Costenoble

6th Edition

1285415310, 9781285415314

More Books

Students also viewed these Mathematics questions