

Answered step by step
Verified Expert Solution
Question
1 Approved Answer
Please include instruction and cell references Data Tables - Example Hello Company makes three different products. Due to the constraints of their manufacturing equipment and
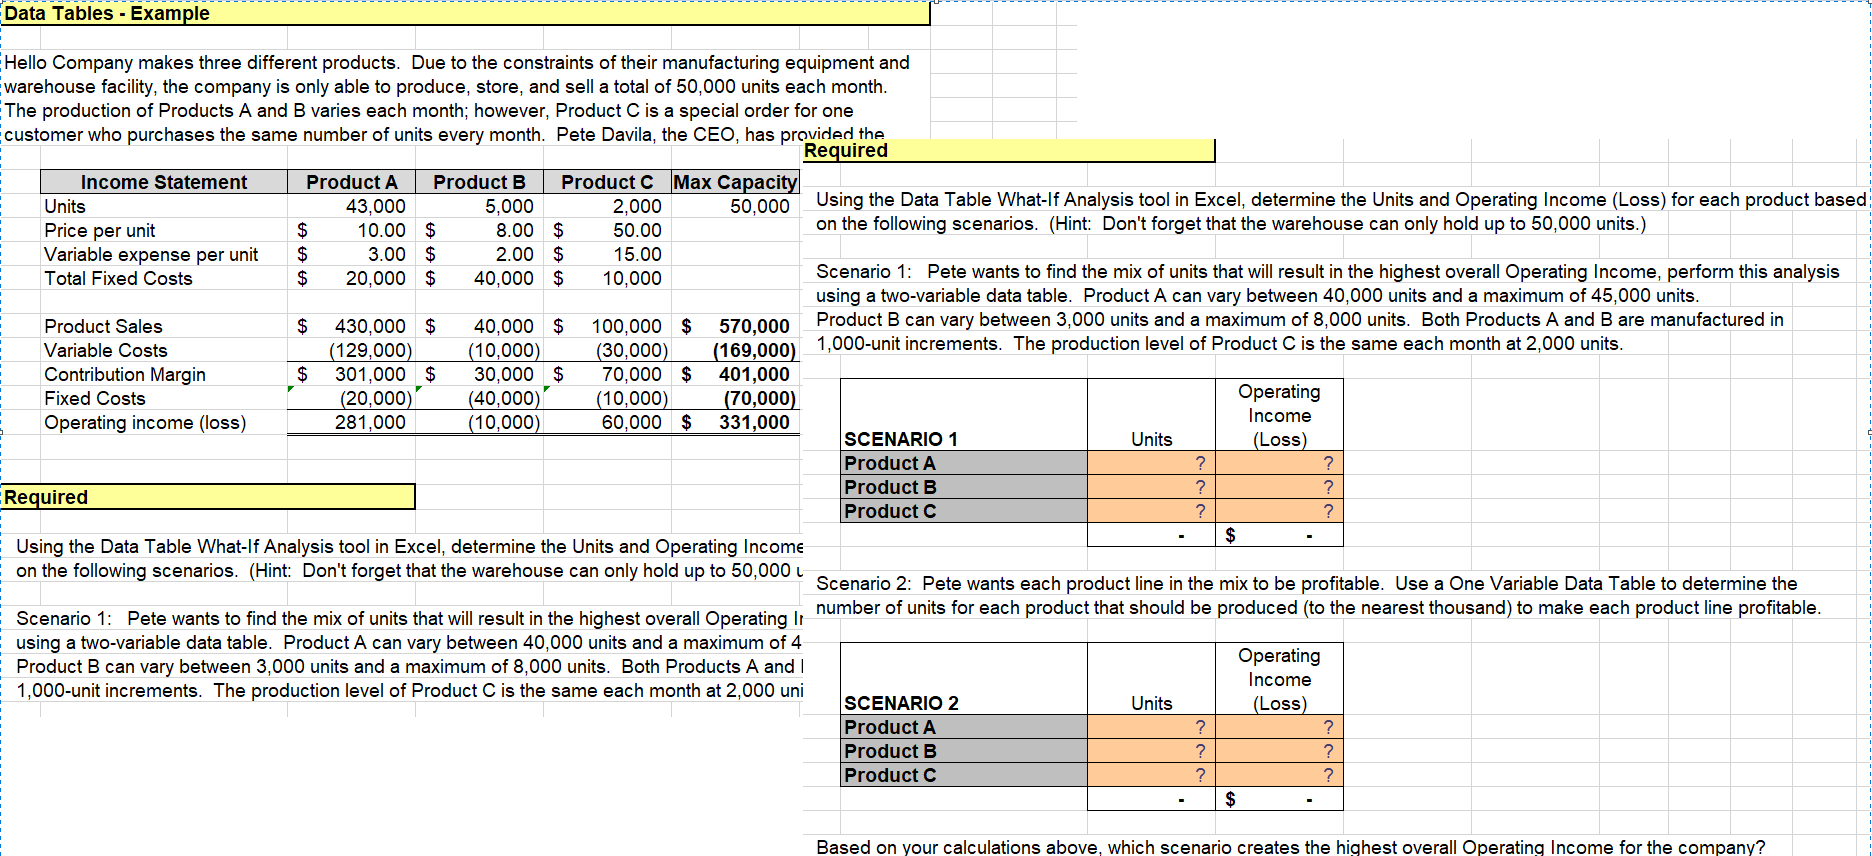
Please include instruction and cell references
Data Tables - Example Hello Company makes three different products. Due to the constraints of their manufacturing equipment and warehouse facility, the company is only able to produce, store, and sell a total of 50,000 units each month. The production of Products A and B varies each month; however, Product C is a special order for one customer who purchases the same number of units every month. Pete Davila, the CEO, has provided the Required Income Statement Product A Product B Product C Max Capacity Units 43,000 5,000 2,000 50,000 Using the Data Table What-If Analysis tool in Excel, determine the Units and Operating Income (Loss) for each product based Price per unit $ 10.00 $ 8.00 $ 50.00 on the following scenarios. (Hint: Don't forget that the warehouse can only hold up to 50,000 units.) Variable expense per unit $ 3.00 $ 2.00 $ 15.00 Total Fixed Costs $ 20,000 $ 40,000 $ 10,000 Scenario 1: Pete wants to find the mix of units that will result in the highest overall Operating Income, perform this analysis using a two-variable data table. Product A can vary between 40,000 units and a maximum of 45,000 units. Product Sales $ 430,000 $ 40,000 $ 100,000 $ 570,000 Product B can vary between 3,000 units and a maximum of 8,000 units. Both Products A and B are manufactured in Variable Costs (129,000) (10,000) (30,000) (169,000) 1,000-unit increments. The production level of Product C is the same each month at 2,000 units. Contribution Margin $ 301,000 $ 30,000 $ 70,000 $ 401,000 Fixed Costs (20,000) (40,000) (10,000) (70,000) Operating Operating income (loss) 281,000 (10,000) 60,000 $ Income 331,000 SCENARIO 1 Units (Loss) Product A ? ? Product B ? ? Required Product C ? ? $ Using the Data Table What-lf Analysis tool in Excel, determine the Units and Operating Income on the following scenarios. (Hint: Don't forget that the warehouse can only hold up to 50,000 1 Scenario 2: Pete wants each product line in the mix to be profitable. Use a One Variable Data Table to determine the Scenario 1: Pete wants to find the mix of units that will result in the highest overall Operating I, number of units for each product that should be produced (to the nearest thousand) to make each product line profitable. using a two-variable data table. Product A can vary between 40,000 units and a maximum of 4 Operating Product B can vary between 3,000 units and a maximum of 8,000 units. Both Products A and I Income 1,000-unit increments. The production level of Product C is the same each month at 2,000 uni SCENARIO 2 Units (Loss) Product A ? ? Product B ? ? Product C ? $ ? Based on your calculations above, which scenario creates the highest overall Operating Income for the companyStep by Step Solution
There are 3 Steps involved in it
Step: 1

Get Instant Access to Expert-Tailored Solutions
See step-by-step solutions with expert insights and AI powered tools for academic success
Step: 2

Step: 3
Ace Your Homework with AI
Get the answers you need in no time with our AI-driven, step-by-step assistance
Get Started
Financial Accounting And Reporting
Authors: Barry Elliott, Jamie Elliott
19th Edition
1292255994, 9781292255996