Question: Please include the MATLAB script. I appreciate it so much! I have inluded the values of the ECG data needed . Time(s) 0.01 0.02 0.03


Please include the MATLAB script. I appreciate it so much! I have inluded the values of the ECG data needed .
Time(s)
| 0.01 |
| 0.02 |
| 0.03 |
| 0.04 |
| 0.05 |
| 0.06 |
| 0.07 |
| 0.08 |
| 0.09 |
| 0.1 |
| Lead I (mV) |
| 0.00915 |
| 0.01464 |
| 0.009 |
| 0.01968 |
| 0.02914 |
| 0.04943 |
| 0.05645 |
| 0.07415 |
| 0.06851 |
| 0.06134 |
| Lead III (mV) |
| -0.06866 |
| -0.06989 |
| -0.06882 |
| -0.0589 |
| -0.07126 |
| -0.07568 |
| -0.05997 |
| -0.05905 |
| -0.03662 |
| -0.07156 |
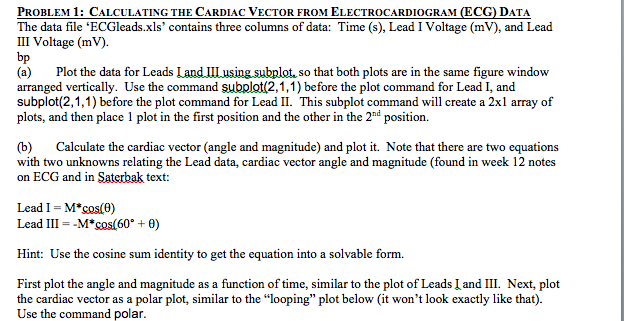
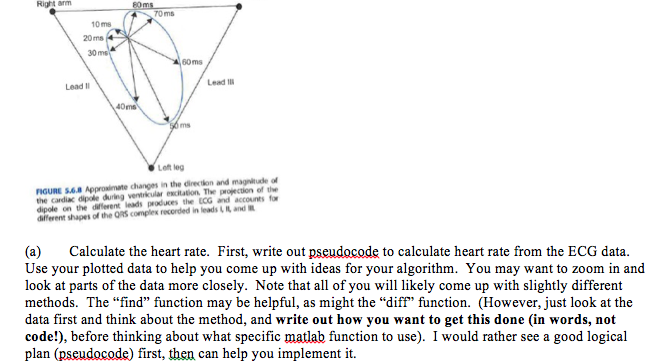
PROBLEM 1: CALCULATING THE CARDIAC VECTOR FROM ELECTROCARDIOGRAM (ECG) DATA The data file 'ECGleads.xls' contains three columns of data: Time (s), Lead I Voltage (mV), and Lead 111 Voltage (m V). bp (a) Plot the data for Leads Land lllusing subplot, so that both plots are in the same figure window arranged vertically. Use the command subplot(2,1,1) before the plot command for Lead I, and subplot(2,1,1) before the plot command for Lead II. This subplot command will create a 2xl array of plots, and then place 1 plot in the first position and the other in the 2d position. (b) Calculate the cardiac vector (angle and magnitude) and plot it. Note that there are two equations with two unknowns relating the Lead data, cardiac vector angle and magnitude (found in week 12 notes on ECG and in Saterbak text: Lead I M*cos(e) Lead 111 =-M*cos(60 + ?) Hint: Use the cosine sum identity to get the equation into a solvable form. First plot the angle and magnitude as a function of time, similar to the plot of Leads I and III. Next, plot the cardiac vector as a polar plot, similar to the "looping" plot below (it won't look exactly like that). Use the command polar PROBLEM 1: CALCULATING THE CARDIAC VECTOR FROM ELECTROCARDIOGRAM (ECG) DATA The data file 'ECGleads.xls' contains three columns of data: Time (s), Lead I Voltage (mV), and Lead 111 Voltage (m V). bp (a) Plot the data for Leads Land lllusing subplot, so that both plots are in the same figure window arranged vertically. Use the command subplot(2,1,1) before the plot command for Lead I, and subplot(2,1,1) before the plot command for Lead II. This subplot command will create a 2xl array of plots, and then place 1 plot in the first position and the other in the 2d position. (b) Calculate the cardiac vector (angle and magnitude) and plot it. Note that there are two equations with two unknowns relating the Lead data, cardiac vector angle and magnitude (found in week 12 notes on ECG and in Saterbak text: Lead I M*cos(e) Lead 111 =-M*cos(60 + ?) Hint: Use the cosine sum identity to get the equation into a solvable form. First plot the angle and magnitude as a function of time, similar to the plot of Leads I and III. Next, plot the cardiac vector as a polar plot, similar to the "looping" plot below (it won't look exactly like that). Use the command polar
Step by Step Solution
There are 3 Steps involved in it

Get step-by-step solutions from verified subject matter experts


