Please include/show ALL work; including any/all necessary excel screenshots with explanations of how to get results. Please provide thorough explanations to ALL discussion questions. Thank you!
1. Design an inventory control system for this business. Provide the formulas that you would use for a P System, Q system or other system you design. Compare these to the formulas currently used. Examine the data from the Appendix to note any peculiarities in demand that your system might encounter. What would you do about them?
2. Describe how the system you have designed will help the company meet customer-service and cost objectives.
3. Is a P System or a Q System more appropriate for this item? Explain. What formulas are needed for your suggested system, and how do they compare to the formulas currently being used?
4. Design an inventory control system for this business, based on your suggestion in question 3.
5. What customer-service objectives are reasonable for this business?
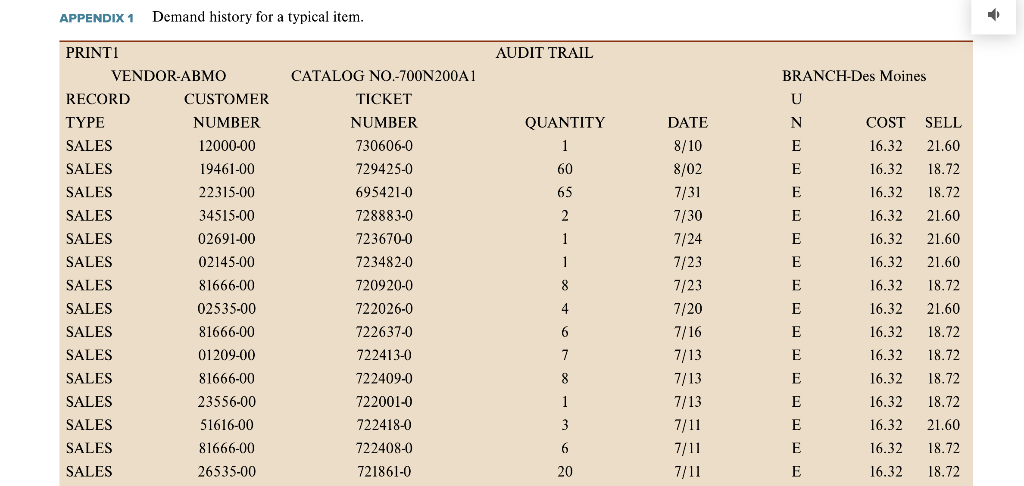
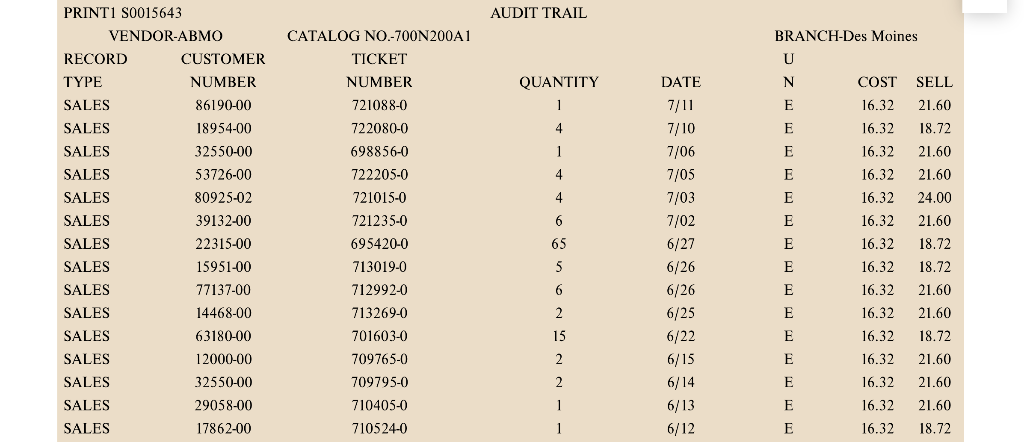
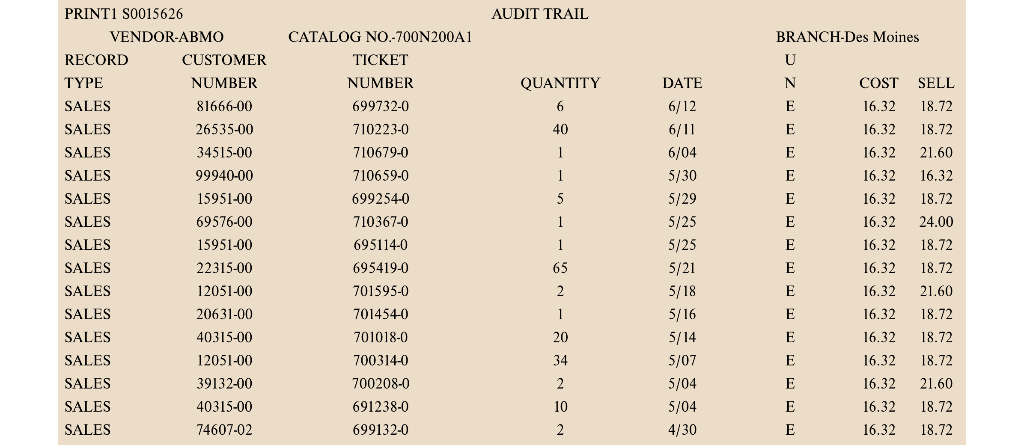
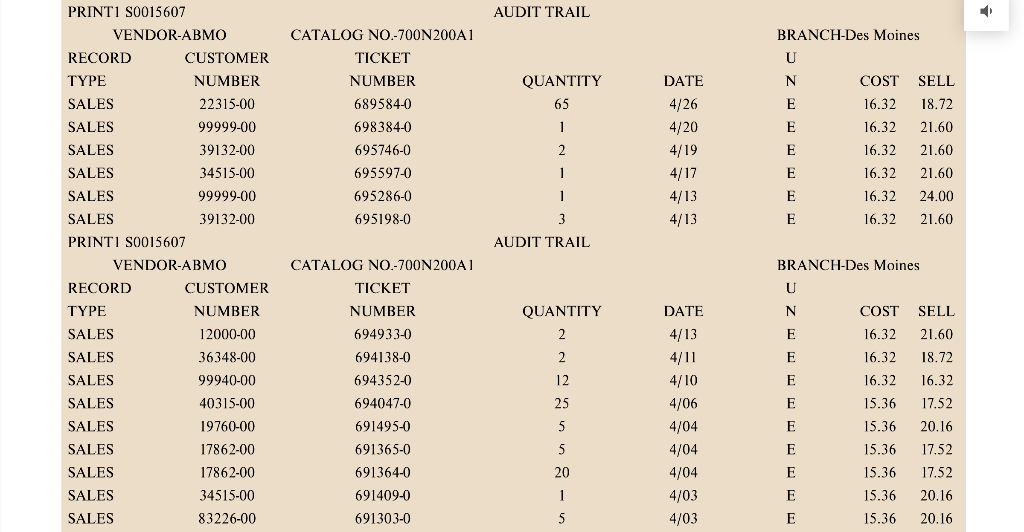
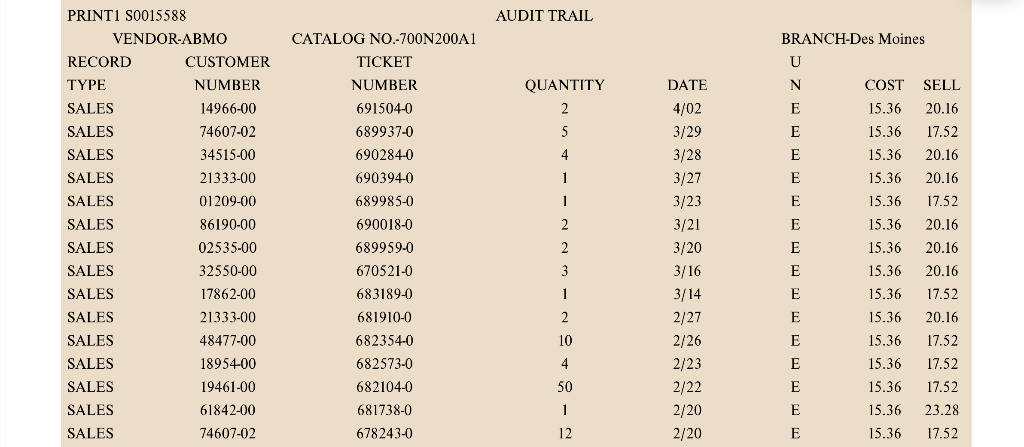
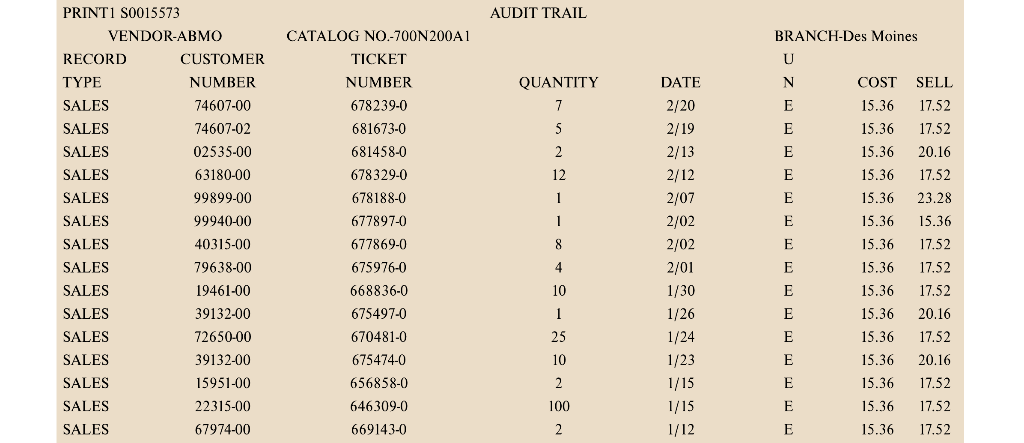
Case Study Consolidated Electric: Inventory Control Jose Flores, the sole owner and president of Consolidated Electric Company, reflected on his inventory management Page 474 problems. He was a major wholesale supplier of equipment and supplies to electrical contractors, and his business hinged on the efficient management of inventories to meet his customers' needs. While he had built a very successful business, he was nearing retirement and wanted to pass along a good inventory management system to his daughter who would take over management of the company. Flores started Consolidated Electric Company in the 1980s and built it into a highly profitable business. In 2016 the company had achieved $10 million in sales and earned $1 million in pretax profits. Consolidated Electric was currently the twelfth largest electrical wholesaler in the country. Consolidated Electric operates through four warehouses in the Midwest (Des Moines, Duluth, Madison, and St. Louis). From these sites, contractors in lowa, Minnesota, Nebraska, Wisconsin, Illinois, and Missouri are supplied with a wide range of electrical equipment, including wire, electrical boxes, connectors, lighting fixtures, and electrical controllers. The company stocks 20,000 separate line items in its inventory purchased from 200 different manufacturers. (A line item is defined as a particular item carried at a particular location.) These items range from less than 1 cent each to several hundred dollars for the largest electrical controllers. Of the 20,000 line items, a great many are carried to provide a full line of service. For example, the top 2,000 items account for 50 percent of the sales and the bottom 10,000 items for only 20 percent. The remaining 8,000 items account for 30 percent of the sales. The company has continually purged its 20,000 inventory items to carry only those that are demanded at least once a year. As Flores says, We live and die by good customer service at a reasonable selling price. If we do not meet this objective, the customer will go to another wholesaler or buy directly from the manufacturer. He explained that he currently managed inventory by using an "earn and turn" concept. According to this concept, the earnings margin multiplied by the inventory turn ratio must equal a constant value of 2.0. For example, if a particular electrical item costs $6 to purchase wholesale and is sold for $10, then the earnings margin is $4 and the earn ratio for this item is $4/$10 = .40. If this item has a turn ratio of 5 times a year (sales are 5 times the average inventory carried), then the product of earn and turn is .4(5) = 2.0. If another item earns more, it can turn slower; if it earns less, it must turn faster. Each year, Flores sets a target earn-turn ratio for the entire business and a value for each product line. These targets are based on the estimated costs of operations and the return-on-investment goal for the company. As stated above, the current target ratio for the business is 2.0. The purchasing agents and inventory managers at each location are measured by their ability to meet the target earn-turn ratios on their product lines. The actual ratios are reported monthly. Although earn-turn ratios work quite well in controlling profitability of the business and entire product lines, they do not work very well for individual inventory items. Some line items tend to be in excess supply, while others are often out of stock. The inventory is currently managed using basic software. A record for each item is kept and a worker posts transactions on the record as units are received or issued, thus keeping a running on-hand inventory balance. Periodically, a purchasing agent reviews the records for a particular supplier. Then, using the order point and quantity stored on the record, the purchasing agent places an order for all items that are below their reorder point. If the total quantities of all items required from a supplier do not meet the purchase discount minimums or a truckload lot, additional items near their reorder points are added to the order. This is not done when the total order size is too far from the minimums, since excessive inventories would build up. The order quantity and reorder point on each record are based on judgment and past experience. Generally speaking, a three- month supply is ordered for low-cost items and as little as a one-month supply for expensive items. Most lines are reviewed on a weekly basis. Consolidated Electric had been converting its inventory records to a new software system. At the present time, an on-hand balance is maintained and an accurate history of all orders placed, receipts, and issues is kept. A demand history for a typical item is shown in Appendix 1. Page 476 APPENDIX 1 Demand history for a typical item. AUDIT TRAIL DATE QUANTITY 1 60 65 8/10 8/02 7/31 18.72 2 1 1 7/30 7/24 PRINTI VENDOR-ABMO RECORD CUSTOMER TYPE NUMBER SALES 12000-00 SALES 19461-00 SALES 22315-00 SALES 34515-00 SALES 02691-00 SALES 02145-00 SALES 81666-00 SALES 02535-00 SALES 81666-00 SALES 01209-00 SALES 81666-00 SALES 23556-00 SALES 51616-00 SALES 81666-00 SALES 26535-00 CATALOG NO.-700N200A 1 TICKET NUMBER 730606-0 729425-0 695421-0 728883-0 723670-0 723482-0 720920-0 722026-0 722637-0 722413-0 722409-0 722001-0 722418-0 722408-0 721861-0 BRANCH-Des Moines U N COST SELL E 16.32 21.60 E 16.32 E 16.32 18.72 E 16.32 21.60 E 16.32 21.60 E 16.32 21.60 E 16.32 18.72 E 16.32 21.60 E 16.32 18.72 E 16.32 18.72 E 16.32 18.72 E 16.32 18.72 E 16.32 21.60 E 16.32 18.72 E 16.32 18.72 8 4 7/23 7/23 7/20 7/16 7/13 7/13 7/13 7/11 7/11 7/11 6 7 8 1 6 20 AUDIT TRAIL BRANCH-Des Moines U SELL QUANTITY 1 COST 16.32 N E E E E 4 1 16.32 4 4 PRINT1 S0015643 VENDOR-ABMO RECORD CUSTOMER TYPE NUMBER SALES 86190-00 SALES 18954-00 SALES 32550-00 SALES 53726-00 SALES 80925-02 SALES 39132-00 SALES 22315-00 SALES 15951-00 SALES 77137-00 SALES 14468-00 SALES 63180-00 SALES 12000-00 SALES 32550-00 SALES 29058-00 SALES 17862-00 E E CATALOG NO.-700N200A1 TICKET NUMBER 721088-0 722080-0 698856-0 722205-0 721015-0 721235-0 695420-0 713019-0 712992-0 713269-0 701603-0 709765-0 709795-0 710405-0 710524-0 6 21.60 18.72 21.60 21.60 24.00 21.60 18.72 18.72 21.60 E DATE 7/11 7/10 7/06 7/05 7/03 7/02 6/27 6/26 6/26 6/25 6/22 6/15 6/14 6/13 6/12 65 5 16.32 16.32 16.32 16.32 16.32 16.32 16.32 16.32 16.32 16.32 16.32 6 E E E E E 2 15 21.60 18.72 21.60 21.60 2 2 1 1 E E E 16.32 16.32 21.60 18.72 AUDIT TRAIL BRANCH-Des Moines U QUANTITY N 6 E 40 1 1 E E E E 5 PRINT1 S0015626 VENDOR-ABMO RECORD CUSTOMER TYPE NUMBER SALES 81666-00 SALES 26535-00 SALES 34515-00 SALES 99940-00 SALES 15951-00 SALES 69576-00 SALES 15951-00 SALES 22315-00 SALES 12051-00 SALES 20631-00 SALES 40315-00 SALES 12051-00 SALES 39132-00 SALES 40315-00 SALES 74607-02 CATALOG NO.-700N 200A1 TICKET NUMBER 699732-0 710223-0 710679-0 710659-0 699254-0 710367-0 695114-0 695419-0 701595-0 7014540 701018-0 700314-0 700208-0 691238-0 699132-0 DATE 6/12 6/11 6/04 5/30 5/29 5/25 5/25 5/21 5/18 5/16 5/14 COST 16.32 16.32 16.32 16.32 16.32 16.32 16.32 16.32 16.32 16.32 E 1 1 E SELL 18.72 18.72 21.60 16.32 18.72 24.00 18.72 18.72 21.60 18.72 18.72 18.72 21.60 18.72 18.72 65 E E 2 1 20 E 16.32 5/07 34 2 10 E E E E 16.32 16.32 5/04 5/04 4/30 16.32 16.32 2 E AUDIT TRAIL D BRANCH-Des Moines U QUANTITY 65 CATALOG NO.-700N 200A1 TICKET NUMBER 689584-0 698384-0 695746-0 695597-0 695286-0 695198-0 N E E 1 DATE 4/26 4/20 4/19 4/17 4/13 4/13 COST 16.32 16.32 16.32 16.32 SELL 18.72 21.60 21.60 21.60 2 E E 1 1 E 16.32 16.32 24.00 21.60 3 E AUDIT TRAIL PRINT1 S0015607 VENDOR-ABMO RECORD CUSTOMER TYPE NUMBER SALES 22315-00 SALES 99999-00 SALES 39132-00 SALES 34515-00 SALES 99999-00 SALES 39132-00 PRINTI S0015607 VENDOR-ABMO RECORD CUSTOMER TYPE NUMBER SALES 12000-00 SALES 36348-00 SALES 99940-00 SALES 40315-00 SALES 19760-00 SALES 17862-00 SALES 17862-00 SALES 34515-00 SALES 83226-00 QUANTITY CATALOG NO.-700N 200A1 TICKET NUMBER 694933-0 694138-0 694352-0 DATE 4/13 2 2. 12 BRANCH-Des Moines U N COST SELL E 16.32 21.60 E 16.32 18.72 E 16.32 16.32 E 15.36 17.52 E 15.36 20.16 E 15.36 17.52 E 15.36 17.52 E 15.36 20.16 E 15.36 20.16 25 5 5 4/10 4/06 4/04 4/04 4/04 4/03 4/03 694047-0 691495-0 691365-0 691364-0 691409-0 691303-0 20 1 5 AUDIT TRAIL QUANTITY 2 5 4 1 1 PRINT1 S0015588 VENDOR-ABMO RECORD CUSTOMER TYPE NUMBER SALES 14966-00 SALES 74607-02 SALES 34515-00 SALES 21333-00 SALES 01209-00 SALES 86190-00 SALES 02535-00 SALES 32550-00 SALES 17862-00 SALES 21333-00 SALES 48477-00 SALES 18954-00 SALES 19461-00 SALES 61842-00 SALES 74607-02 CATALOG NO.-700N 200A1 TICKET NUMBER 691504-0 689937-0 690284-0 690394-0 689985-0 690018-0 689959-0 670521-0 683189-0 681910-0 682354-0 682573-0 682104-0 681738-0 678243-0 DATE 4/02 3/29 3/28 3/27 3/23 3/21 3/20 BRANCH-Des Moines U N COST SELL E 15.36 20.16 E 15.36 17.52 E 15.36 20.16 E 15.36 20.16 E 15.36 17.52 E 15.36 20.16 E 15.36 E 15.36 20.16 E 15.36 17.52 2 20.16 3/16 E 15.36 15.36 20.16 17.52 E 3 1 2 10 4 50 1 12 3/14 2/27 2/26 2/23 2/22 2/20 2/20 E E E E 15.36 15.36 15.36 15.36 17.52 17.52 23.28 17.52 AUDIT TRAIL BRANCH-Des Moines U N E QUANTITY 7 5 2 12 E E E COST 15.36 15.36 15.36 15.36 PRINT1 S0015573 VENDOR-ABMO RECORD CUSTOMER TYPE NUMBER SALES 74607-00 SALES 74607-02 SALES 02535-00 SALES 63180-00 SALES 99899-00 SALES 99940-00 SALES 40315-00 SALES 79638-00 SALES 19461-00 SALES 39132-00 SALES 72650-00 SALES 39132-00 SALES 15951-00 SALES 22315-00 SALES 67974-00 CATALOG NO.-700N200A 1 TICKET NUMBER 678239-0 681673-0 681458-0 678329-0 678188-0 677897-0 677869-0 675976-0 668836-0 675497-0 670481-0 675474-0 656858-0 1 1 DATE 2/20 2/19 2/13 2/12 2/07 2/02 2/02 2/01 1/30 1/26 1/24 E E E 15.36 15.36 8 SELL 17.52 17.52 20.16 17.52 23.28 15.36 17.52 17.52 17.52 20.16 17.52 20.16 17.52 17.52 4 15.36 15.36 15.36 15.36 E E E 10 1 25 10 15.36 E E 1/23 1/15 2 100 E E 15.36 15.36 15.36 646309-0 669143-0 1/15 1/12 2 E 15.36 17.52 Des Moines ITEM INVENTORY FILE CONTROL RELAY INV/CLSA CARRIED IN S DESCRIPTION 700N 200AI PRINTIS VEND CATALOG NO. ABMO 700N 200A1 QTY. ON QTY. ON HAND ORDER 371 200 QTY ALLOCATED 0 ORDER POINT 38 E.O.Q. 453 LEAD TIME 11 1 2 10 3 15 MAX 20 QTY. SOLD BY MONTH QTY. SOLD BY QUARTER JUNE 121 JAN-MAR 356 MAY 154 OCT-DEC 292 APRIL 76 JUL-SEP 505 MARCH 203 APR-JUN 201 Flores was anxious to utilize the new system to calculate reorder points and order quantities, but he was unsure of the exact formulas to use. Using standard textbooks in the inventory field, he developed the formulas given in Exhibit 1. The EOQ formula utilizes a carrying cost of 28 percent and an ordering cost of $4.36 per order placed. These figures were based on past cost history at the company. Page 475 EXHIBIT 1 Formulas for calculating reorder points and quantities. Maximum lead time - Average lead time Delivery delay = Average lead time Safety allowance = Usage * Average lead time x 8 x Delivery delay Order point = Usage * Average lead time + Safety allowance 2 x 4.36 x Daily useage x 365 EOQ = 0.28 x Unit cost Line point = Daily usage * 7 + Order point Quantity to order = (Order point) - (Quantity on order) - (Quantity on hand) + Quantity allocated + EOQ Note: The line point used to generate orders for all items in a line which are within one week of their order points. These orders may be used to meet truckload minim The formulas were tested on a pilot basis. For some items the formulas seemed to work quite well, but for others they resulted in drastic departures from current practice and from common sense. For example, on one electrical box, the formulas would have ordered a two-year supply. Flores wanted to start using the new software as soon as possible, but he was not sure that the formulas would work properly. He wondered whether the formulas would meet the customer-service objectives of the business. Would they take advantage of truckload lots or purchase discounts whenever appropriate, and would the formulas result in reasonable inventory levels? Discussion Questions 1. Review the demand data provided in Appendix 1. Describe any patterns, outliers, or unusual customers that you see represented in the data. 2. Plot the frequency distribution for demand of the item in Appendix 1 and draw conclusions from what you observe. 3. Is a P System or a Q System more appropriate for this item? Explain. What formulas are needed for your suggested system, and how do they compare to the formulas currently being used? 4. Design an inventory control system for this business, based on your suggestion in question 3. 5. What customer-service objectives are reasonable for this business