Answered step by step
Verified Expert Solution
Link Copied!

Question

1 Approved Answer

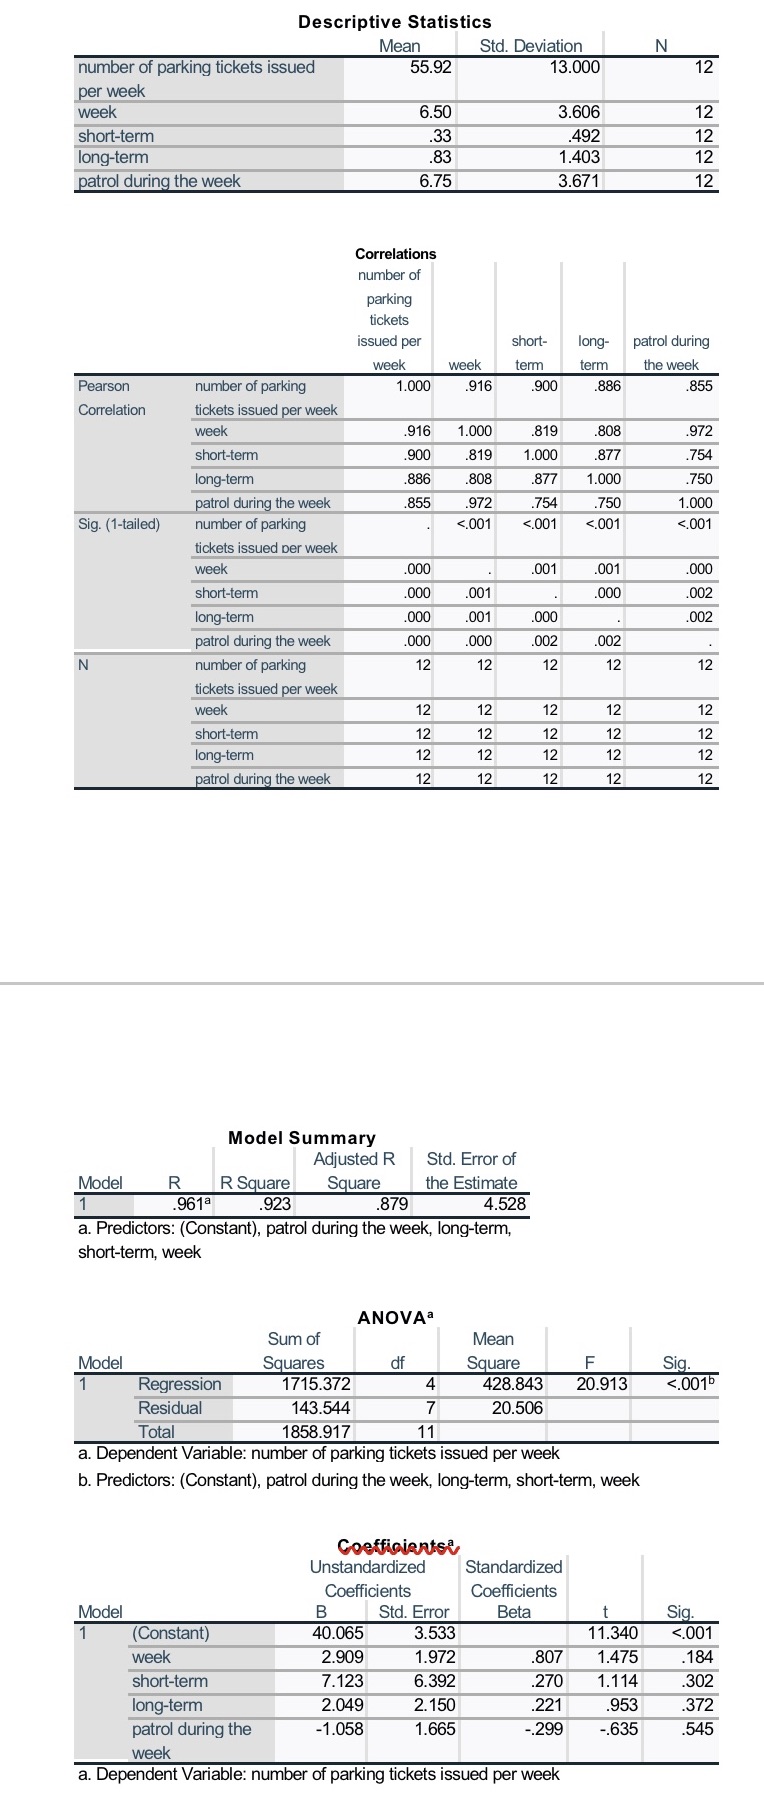
Please interpret the results from the regression Analysis below Descriptive Statistics Mean Std. Deviation N number of parking tickets issued 55.92 13.000 12 per week

Please interpret the results from the regression Analysis below

image text in transcribed
Descriptive Statistics Mean Std. Deviation N number of parking tickets issued 55.92 13.000 12 per week week 6.50 3.606 12 short-term .33 492 12 long-term .83 1.403 12 patrol during the week 6.75 3.671 12 Correlations number of parking tickets issued per short- long- patrol during week week term term the week Pearson number of parking 1.000 .916 .900 886 855 Correlation tickets issued per week week 916 1.000 819 808 972 short-term 900 819 1.000 877 754 long-term 886 .808 877 1.000 750 patrol during the week 855 972 754 750 1.000 Sig. (1-tailed) number of parking <.001 tickets issued per week .001 short-term .000 long-term patrol during the n number of parking model summary adjusted r std. error square estimate a. predictors: anova sum mean squares df f sig. regression residual total dependent variable: b. coefficientsi unstandardized standardized coefficients b beta constant>

Step by Step Solution

There are 3 Steps involved in it

Step: 1

blur-text-image

Get Instant Access to Expert-Tailored Solutions

See step-by-step solutions with expert insights and AI powered tools for academic success

Step: 2

blur-text-image

Step: 3

blur-text-image

Ace Your Homework with AI

Get the answers you need in no time with our AI-driven, step-by-step assistance

Get Started

Recommended Textbook for

An Introduction to Measure Theoretic Probability

Authors: George G. Roussas

2nd edition

128000422, 978-0128000427

More Books

Students also viewed these Mathematics questions

Question

\f

Answered: 1 week ago